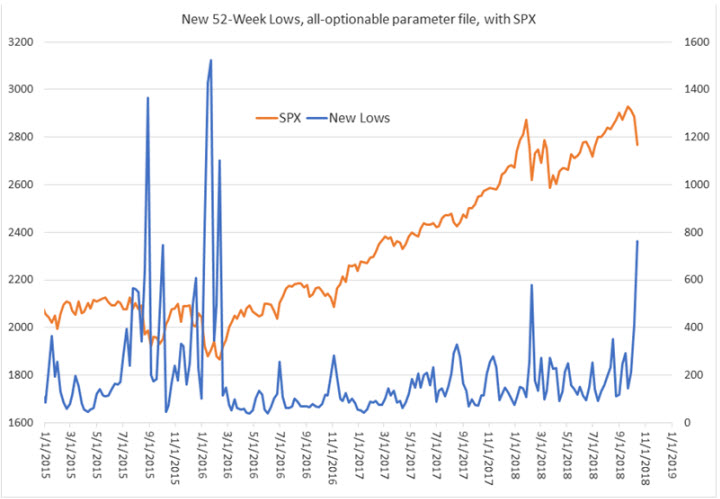
The S&P 500 Index (SPX) last week suffered its worst five-day stretch since March, giving up more than 4% to continue its stretch of selling off after Fed rate hikes. What's more, last week we saw the most 52-week lows since February 2016. However, this could be a bullish signal for the stock market, if recent history is any indicator.
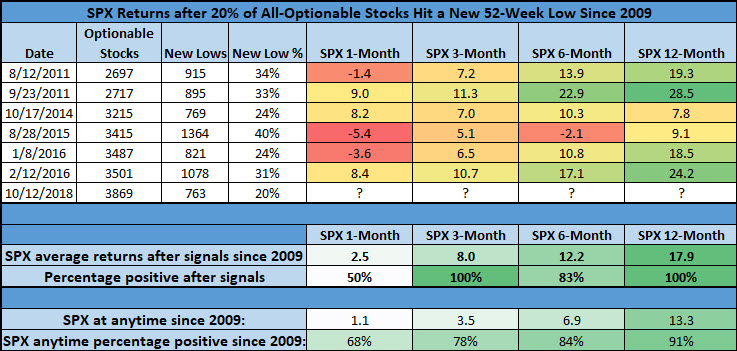
Specifically, looking at optionable stocks -- of which there are 3,869 -- 763 made a new 52-week low last week, per Schaeffer's Quantitative Analyst Chris Prybal. That's nearly 20% of the stocks -- the biggest in percentage terms since Feb. 12, 2016.

There have been just seven instances of this kind since 2009 (looking at one signal every 30 days), and they've preceded stronger-than-usual price action for the S&P. One month after a signal, the index was up an average of 2.5% -- more than double its average anytime one-month gain of 1.1%, since 2009. However, the SPX was higher just 50% of the time a month after signals.
Three months later, though, the index was up 100% of the time after signals, compared to 78% anytime. And the average post-signal three-month gain of 8% is also more than double the norm. Six months after a signal, the S&P 500 was higher by 12.2%, on average, compared to 6.9% anytime. One year later, the broad-market barometer was in the black 100% of the time, up an average of 17.9%, compared to 13.3% anytime.

In conclusion, as Schaeffer's Senior V.P. of Research Todd Salamone recently noted, "There are solid reasons from a technical and options-related point of view on why the market can stabilize and perhaps bounce in the short term. At the same time, the optimism that preceded the rate hike is still being unwound ... and there were some key technical levels that broke down last week that could embolden the shorts and make the longs wary." As such, short-term traders should continue to be open to opportunities on both sides of the market, but if recent technical and sentiment signals are any indicator, stocks could outperform after the recent pullback.
