Last time markets were this oversold we saw the S&P rally over 80 points in a few days so I did buy some long positions late Thursday which so far, are not working great.
The action is not at all great and does point to a deeper correction but not an end to the current bull market.
So, we may be in for a tough year, if you are only trading the long side.
I’ll trade long or short and make money whatever happens, unless we see sideways markets which are very hard to make money in but I don’t see that as being a reality in 2016.
We should see lots of volatility so we should have a good year.
Let’s dive into the metals who had a good week but I still do not see the major low as being in place yet so I wouldn’t overstay your welcome in any recent long positions.

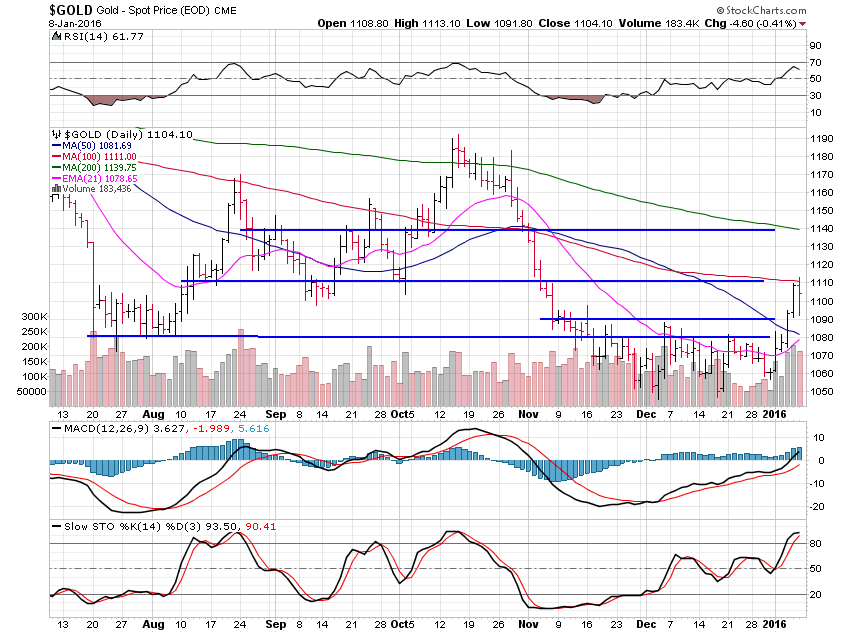
Gold gained a solid 4.11% the first week of 2016.
Great action out of the range and above the major $1,080 pivot area and then above $1,090.
We’re now at the 100 day moving average and horizontal resistance at $1,110 and we are consolidating as expected.
Above here we’ve got the 200 day average and horizontal resistance at $1,140 so we just have to watch the action now and see if we tighten up and setup for a next leg higher, or if this move fizzles out.
I still think we really need to see the $1,000 level hit before we can consider a trend change to up.
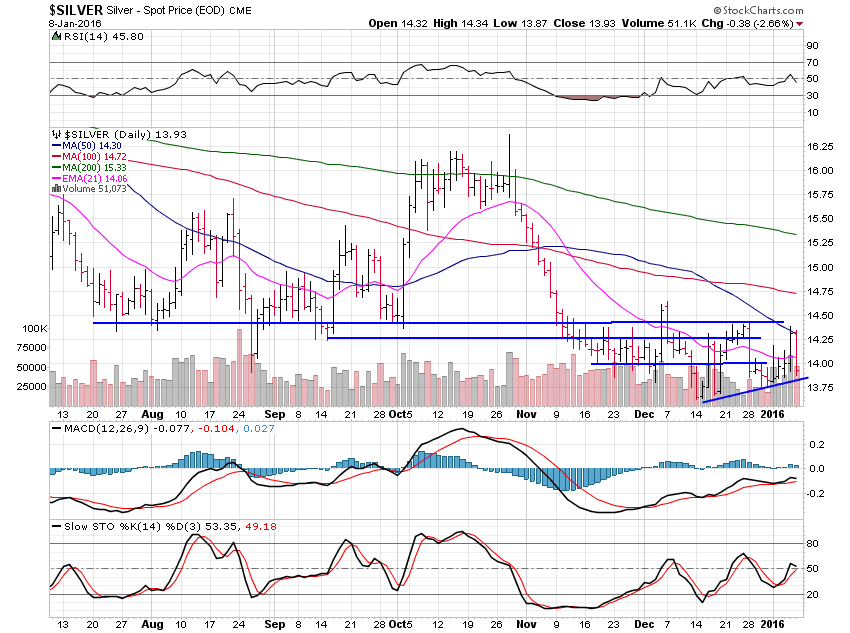
Silver is not confirming the move up in gold also so that is a strike against this move being able to last.

Silver gained only 0.72% as it tries, but so far is failing, to follow gold higher.
If silver can’t get going above $14.50 then gold has no chance at a sustainable move at all.
Silver remains in the range between $14.50 and $14 to $13.75 and will until it won’t.
Not much else to say about silver but the main point is it has to move or gold will quickly come back into its range.

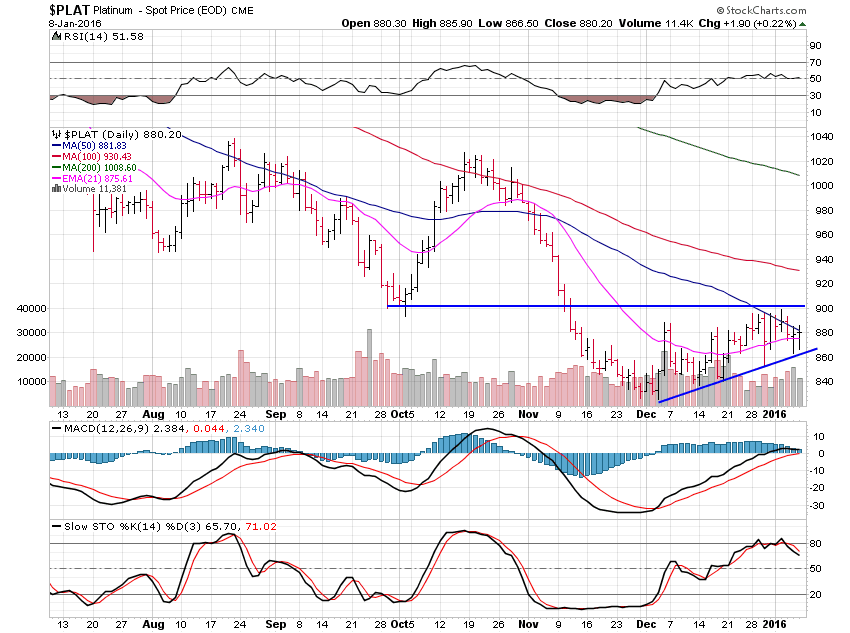
Platinum lost 1.42% as it nears completion of this triangle which points to a break lower.
A move lower would make sense since silver is not confirming the gold move so I still think short is the best trade to look for in terms of precious metals.
The $900 area can be shorted off of with a smaller position size and then a full short position once the rising trend-line is broken, which is the lower side of this continuation pattern triangle which points to a breakdown.

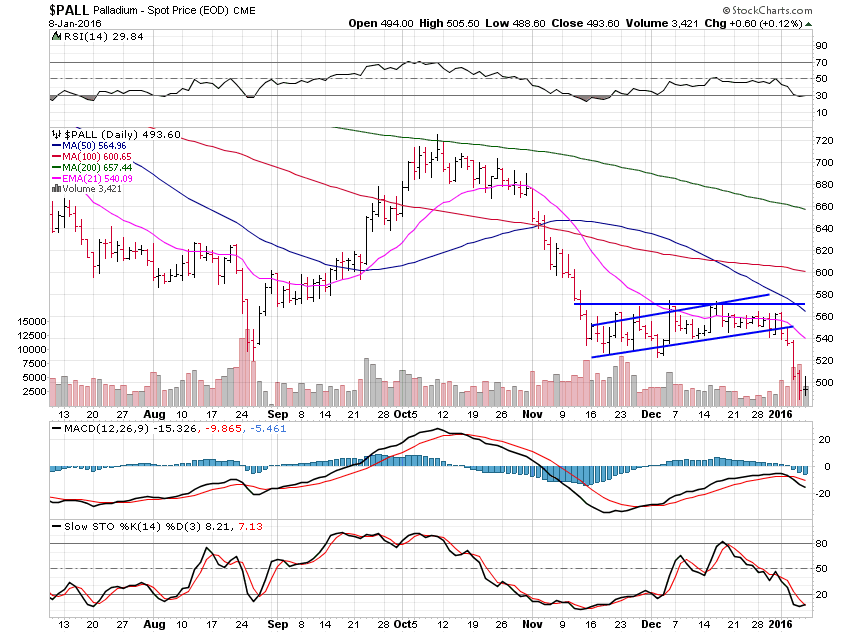
Palladium lost a hefty 12.17% to kick off 2016 and did so on very heavy volume.
$475 is support and if that level is broken then we look to $425 then $390 as the next major support levels and those are on the weekly charts and date back to 2010 and 2008 respectively.
So, in summary, the metals are mixed with gold trying to lead to the upside and palladium trying to lead to the downside with silver and platinum not sure what to do.
As I’ve said many times, I think gold needs to put in a low at the $1,000 area so until that is complete then the major trend will most likely remain down.