Holidays in Greater China and Hong Kong see mixed equities moves with Yen crosses drifting lower on political uncertainty in the U.K and Europe.
With both the U.K. and the U.S. out overnight and with China, Taiwan and Hong Kong dragon boating today, the Asia session was never likely to be a fiery one. This should all start to change this afternoon as the week become very data heavy indeed around the world. Over the next 24 hours the most closely watched data should be U.S. PCE Inflation, always watched closely by the Fed, followed by China’s PMIs. Soggy prints on both in recent times may see the risk-off them in Asia today continue into midweek.
With a lack of direction from New York, Asia’s attentions were focussed mainly on Europe’s travails. P.M May reiterated she would still enact a hard Brexit if Europe did not produce an acceptable deal. Polls continue to show that Labour is only six percent behind the Conservatives. Greece may opt out of its next debt payment ask creditors haggle over debt relief. Italian banks were under pressure as rumours continue to swirl about an early Election in September. Finally, the ECB’s Draghi set a very dovish tone in comments yesterday.
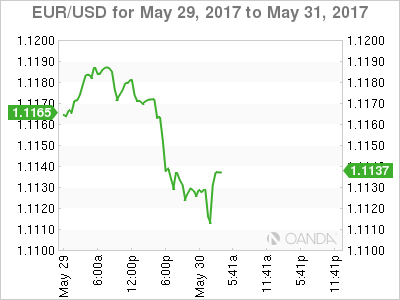
This produced a risk-off environment in Asia with both EUR/USD, AUD/USD and USD/JPY falling on Cross/JPY selling. It had the usual knock on effect on the Nikkei which finishes the day slightly in the red.
FX
EUR/USD fell from 1.1165 to 1.1115 and starts Europe just above its lows at 1.1120. The single currency has support nearby at 1.1100, and the charts suggest a break would see more stop-loss selling appear with the next meaningful chart support around 1.1000. Overhead, resistance appears at 1.1180.
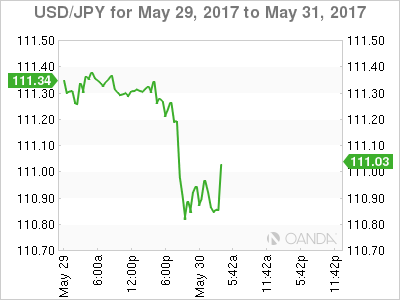
USD/JPY fell through 111.00 early in the session which appears to have triggered short term stop losses. It fell as low as the 110.80 area as investors sold AUD/JPY and EUR/JPY before stabilising around 110.97
USD/JPY has initial support at 110.80 followed by 110.50 ahead of the pivotal 110.00 area. Resistance appears at 111.45 and then 111.85.
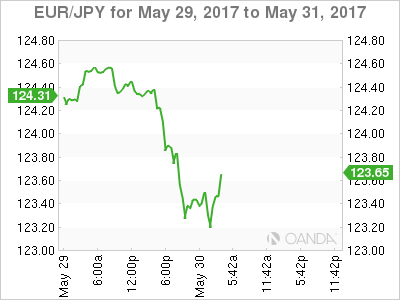
EUR/JPY fell from 124.00 to 123.25 and finishes the session just above there at 110.30 as Asian investors get cold feet on Europe and Draghi’s dovishness. Initial support lies at 123.00 with a daily close possibly signalling a much deeper correction below 122.00 could be on the cards.
Resistance is at 123.55 before more important resistance at 124.25 and 124.55.
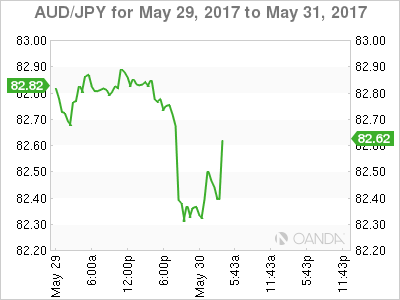
AUD/JPY suffered the same fate as EUR/JPY being a risk-off proxy. The cross dropped from 82.80 to 82.30 before recovering to 82.45. The move down is more significant however as the cross has broken long-term trendline support at 82.60 today. A close below here tonight could imply a further drop to the 81.60 area initially.
Resistance lies at 82.80 and then 82.90 followed by 83.30. Support rests at 82.15 and then 81.60.
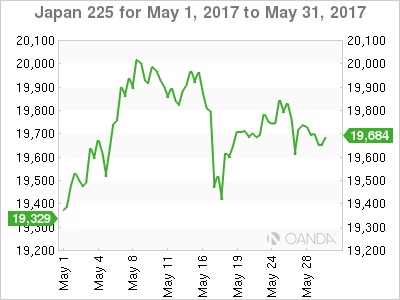
Followed USD/JPY and the crosses lower as per normal procedure. The index is delicately poised at its present level of 19,670. Resistance is now heavy above at 19800 and then 20,050.
Support lies at 19.560 before the vital 19,280 regions. This is the low of the 18th May and the 100-day moving average.
OIL
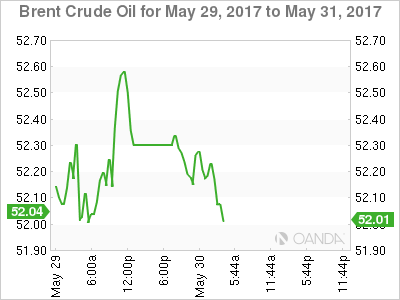
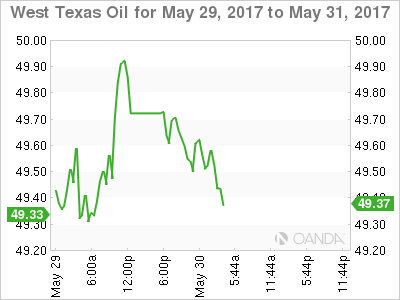
Holiday’s in both the U.S and the U.K saw both Brent and WTI trade sideways through the overnight session to finish up roughly unchanged from Friday’s close. WTI spot did attempt a move higher in thin trading but failed at the 50.00 level before slipping back to the 49.50 region. Brent meanwhile, contented itself to trade quietly in a 52.00/52.50 range for the most part.
With China and Hong Kong out today, we would expect much of the same for the Asia session barring any unexpected headline risk. The week should pick up going forward as we run into a series of data-heavy days around the world.
Brent spot trades at 52.30 with initial support at 51.90 and then 51.00. Initial resistance is at 52.70 followed by 53.00.
WTI spot trades at 49.65 with support at 49.20. Above, 50.00 will form an important pivot, with a move above implying the rally can extend to the 51.00 area initially.
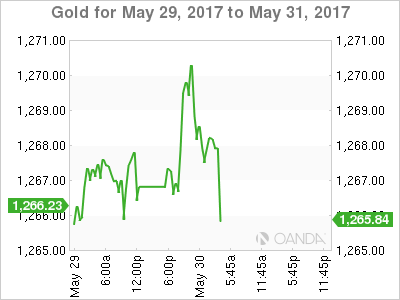
Gold opened with a bid tone in Asia and continued through the session. The bid tone should continue, although the picture will muddy somewhat as we head into a very data heavy rest of the week globally. For now, risk aversion should continue to support gold and precious metals in general.
Gold trades at 1268.50 and is attempting to force its way through the 1270 resistance level just above with 1272 very close behind that. A break of the latter would imply gold may have the legs to reach for 1280 in the coming sessions.
Support also lies nearby at 1264.50 with a break opening up a move to 1260. A close below this level could signal a deeper correction to the 1245 area may be on the cards.
