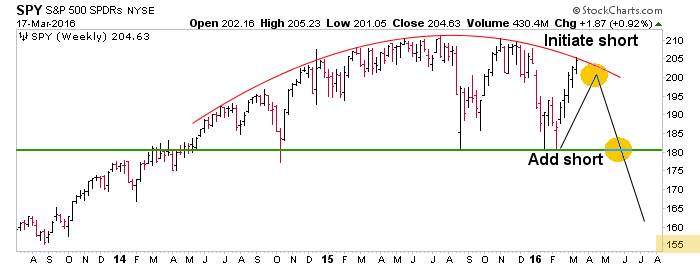
I read an article the other day that focused upon a former mathematics professor who now runs his own Mom & Pop ‘quant’ shop (his home) from the desert plains in New Mexico. The article noted that there are big, powerful quants in New York City and there is a constellation of little guys out there writing their algos and skimming the markets with the precision that mathematical codes instruct.
It was a cute story as our little quant gets to step outside and breathe the desert air when he gets stressed. These little satellites even have their own quant superstore of sorts called Quantopian. Some guys go to home depot or the local hardware store (to the extent they still exist) for their tools. These guys go to Quantopian for their tools and software to build out their own unique quant strategies.
This got me thinking about the markets in general and the S&P 500 in particular. I have called the vast global markets an amalgam of investors, casino patrons, day traders, substance abusers, black boxes and algos because it seems on any given day or week to be a hyper frenetic, emotion-driven mess.
When we projected the bounce in the S&P 500 back when man and machine were still in ‘end of the world’ mode, I noted that I did not expect the bounce to be as long or as strong as the post-September rally, because sentiment had not become quite as bombed out as it did last summer. Well, it turns out I was wrong in that view and indeed, look at how similar SPX’s Thing 2 looks to Thing 1. Silly man, trying to out think machine.

What creeps me out if I am a bull is the precision with which Thing 2 has replicated the earlier Thing (and its subsequent price erection). Have the aggregated quants (big and small) really gained that much control of the markets, so that it follows their combined codes, which after all are based on numbers and algos based on things that have come before? Also, do the machines see that gap? Are they coded to even give a damn about a gap or do they laugh at our silly little human data points?
By extension, the bulls could have a problem as well if the post-Thing 1 phase replicates. I have had one nagging issue with the technical bear case and that issue is that every jockey with a chart has seen the topping structure on the S&P 500. Quants to the rescue for the bears? Or will they find something in the code (maybe from events that are years ago in the bin of history) that indicates that this time the replication will break? Maybe Martin Armstrong’s computer is going to get its Phase Transition here and now?
As a dumb human, I only know that in February everybody was bearish and in March most people are getting bullish. I also know that the market has done what we thought it would do (target: 2000-2030) and more. What goes on now will surely be interesting. The preferred plan was per this simple weekly chart of the SPDR S&P 500 (NYSE:SPY) ETF, produced when the market was still bottoming. We projected the bounce to current levels where an optimal short, amid over bullish sentiment could work out. Now, will the machines play ball or do they see something else?

