📈 69% of S&P 500 stocks beating the index - a historic record! Pick the best ones with AI.See top stocks

SPX Is Right On The Midline

Published 06/14/2017, 12:42 AM
Updated 07/09/2023, 06:31 AM
US500
-

Yawn. The excitement of Friday is another distant memory. We’re back to all equities creeping higher, slowly but surely.

I wanted to share with you an index with which I was unfamiliar with— the S&P Total Return Index, which according to Investopedia:

The total return index is a type of equity index that tracks both the capital gains of a group of stocks over time, and assumes that any cash distributions, such as dividends, are reinvested back into the index. Looking at an index’s total return displays a more accurate representation of the index’s performance. By assuming dividends are reinvested, you effectively account for stocks in an index that do not issue dividends and instead, reinvest their earnings within the underlying company.

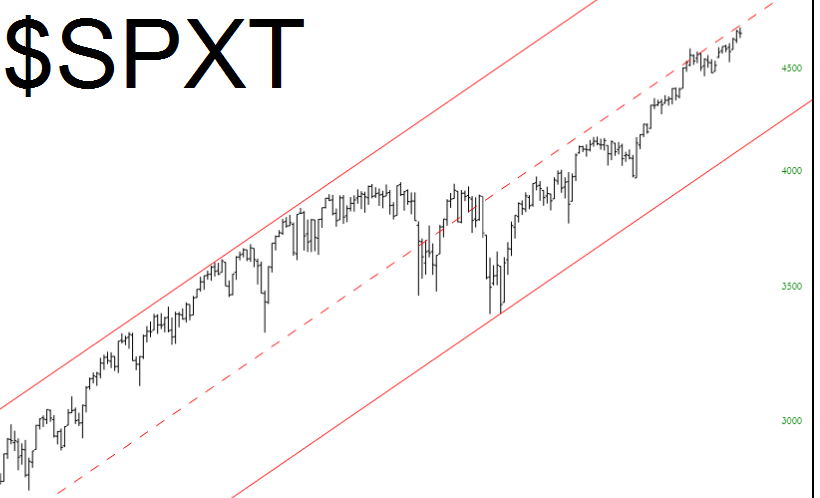
Below is the S&P 500 total return index, and as you can see, it’s been ascending along a channel for years. For a while, it was in the upper half of the channel, and in recent years, it’s been in the lower half of the same channel. At the moment, it’s mushed right up against the midline, which suggests how prone equities are right now.
SPXT

Latest comments

Loading next article…
Risk Disclosure: Trading in financial instruments and/or cryptocurrencies involves high risks including the risk of losing some, or all, of your investment amount, and may not be suitable for all investors. Prices of cryptocurrencies are extremely volatile and may be affected by external factors such as financial, regulatory or political events. Trading on margin increases the financial risks.
Before deciding to trade in financial instrument or cryptocurrencies you should be fully informed of the risks and costs associated with trading the financial markets, carefully consider your investment objectives, level of experience, and risk appetite, and seek professional advice where needed.
Fusion Media would like to remind you that the data contained in this website is not necessarily real-time nor accurate. The data and prices on the website are not necessarily provided by any market or exchange, but may be provided by market makers, and so prices may not be accurate and may differ from the actual price at any given market, meaning prices are indicative and not appropriate for trading purposes. Fusion Media and any provider of the data contained in this website will not accept liability for any loss or damage as a result of your trading, or your reliance on the information contained within this website.
It is prohibited to use, store, reproduce, display, modify, transmit or distribute the data contained in this website without the explicit prior written permission of Fusion Media and/or the data provider. All intellectual property rights are reserved by the providers and/or the exchange providing the data contained in this website.
Fusion Media may be compensated by the advertisers that appear on the website, based on your interaction with the advertisements or advertisers.
© 2007-2024 - Fusion Media Limited. All Rights Reserved.