The best seven-month period for the stock market historically extends from the end of October to the end of May. As we head into the “home stretch” of this period, it is also interesting to note that the April/May period during post-election years has tended to be favorable in recent decades.
(See also The MACD ‘Tell’ Strikes Goldman Sachs)
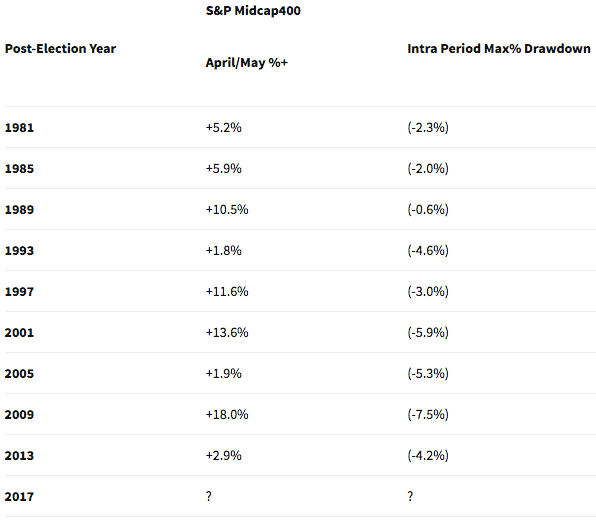
Figure 1 displays the performance of the S&P MidCap 400 index during April and May of post-election years since the index was first calculated in 1981.


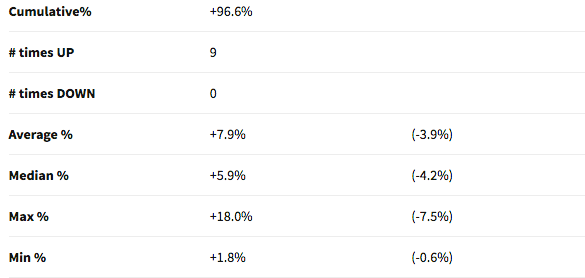
As you can see in Figure 1, the average gain for the S&P MidCap 400 was +7.9% with a median gain of +5.9%. The worst performance to date was a gain of +1.8% in 1993. The smallest intra-period draw-down was -0.6% in 1989 and the largest intra-period draw-down was -7.6% in 2009 (2009 also posted the largest gain of +18.0%).
(See also The ‘Range Bound Consolidation Pattern’)
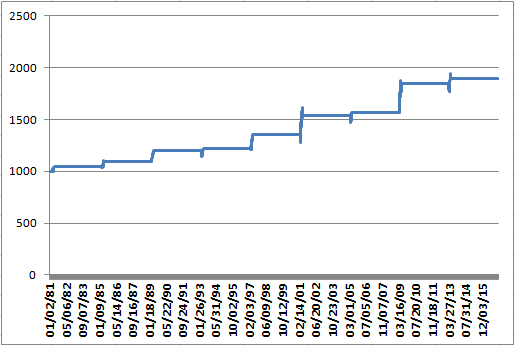
Figure 2 displays the growth of $1,000 invested in the S&P MidCap 400 index only during April and May of each post-election year starting in 1981 (the first year of which the MidCap index was calculated).
Figure 2 – Growth of $1,000 invested in S&P MidCap 400 Index only during April and May of post-election years (1981-2017)
Summary
Murphy’s Law being what it is, none of this should be taken as a sign that the MidCap index is sure to rise between the end of March and the end of May in 2017 — especially given that it lost roughly -0.6% on the 1st trading day of April. Still, if history proves to be an accurate guide, investors may be wise to ignore the news and ride the trend.

