From what I can tell, Apple (NASDAQ:AAPL) is the most popular company, and stock, on the planet, maybe even in the Universe. It is also the largest market capitalization stock you can find and quite probably going to be the first company valued at $1 trillion. It is taking over the Universe.
You have heard opinions from market gods and idols about this stock. Carl Icahn thinks it can move to over $200/ share. You have also heard absurd comparisons from those same gods and idols looking at its P/E without cash and comparing it to the broad market to show how cheap it is. I am not sure how that is different from comparing the company to an orange, but whatever.
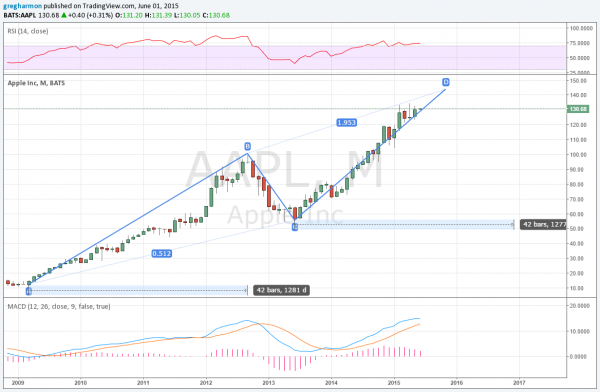
There is strong evidence that the stock can continue to go higher just because the stock is going higher. I’ll leave it to you to determine if that statement falls into the genius or absurd side of things. But the chart of price action since the 2009 low does suggest more upside.

A simple AB=CD pattern dominates this chart. And what does it say? Two things, first that there is more upside coming. Second, that it could take a long time to achieve. Let’s look at the the first statement.
The AB=CD pattern targets a move to 143.75. That is 10% above the current price. At the completion of the pattern you could look for a retracement of 38.2 to 50%. But these patterns can often extend as well. The CD leg can extend to 138.2% or 150% or 161.8% of the AB leg. So a 10% higher target looks like more of a minimum level. A 161.8% extension would Carl his $200 level.
It is the second statement about timing that makes it a bit less interesting. This AB=CD pattern is one of the few in technical analysis that gives a potential timeframe for a move. In this case an equivalent time as it took for leg AB, or 42 months. That places the target at the end of 2016. A 10% move over 18 months kind of changes the dynamics of holding the stock. This time measure is often surpassed, so it could happen a lot faster. You can see just 5 months ago where the stock moved over $15 in one month, for example.
But as a guideline, if gives a rough bound. 10% in 18 months at one end. At the other end maybe 50% in less time. That certainly sounds better. No one knows which one it will be or what may happen in between. But one thing is clear. Even though you may have missed a 136% rise already, the stock wants to go higher. Only you can decide if the reward is enough for your taste.
Disclosure: The information in this blog post represents my own opinions and does not contain a recommendation for any particular security or investment. I or my affiliates may hold positions or other interests in securities mentioned in the Blog, please see my Disclaimer page for my full disclaimer.
