US Stocks, lead by technology since 2008, remain in cause building within broader mark up phase.
The unwinding of extreme optimism within cause, the transfer of ownership in which the minority fades the actions of the majority, continues for US stocks. Intermarket analysis confirms this transfer.
Insights tracks the flow of sentiment that compliments a broader message price, leverage and time discussed further in Review of US Stocks help recognize the transition from cause (building) to mark up or mark down for subscribers.
Sentiment
US stocks
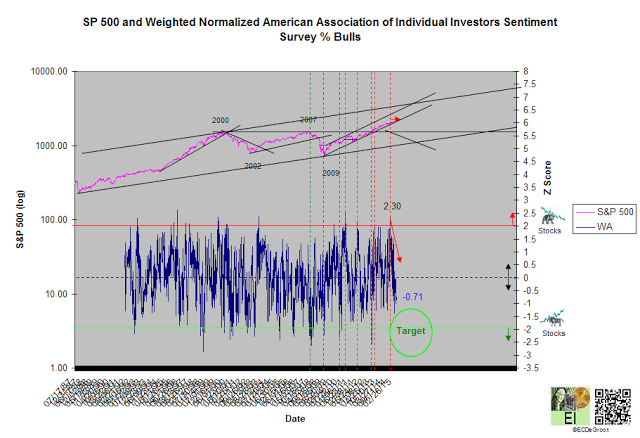
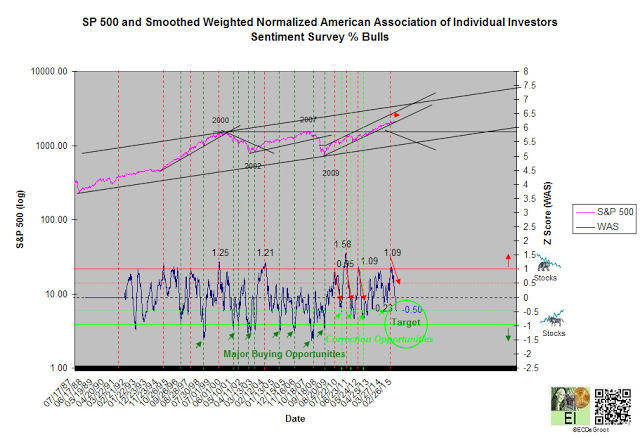
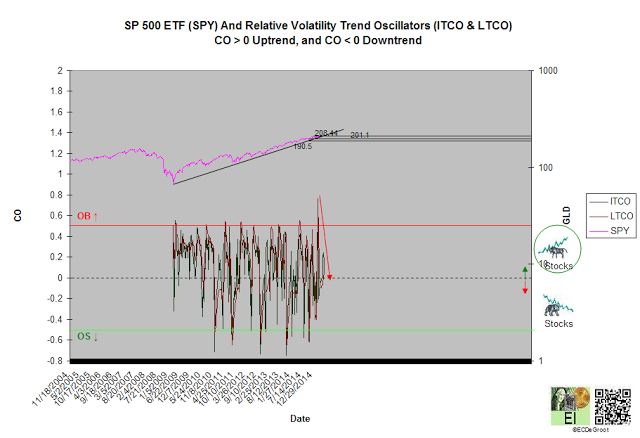
- The unwinding of extreme optimism within cause (distribution), the transfer of ownership in which the minority fades the actions of the majority, has been ongoing since late November 2014. The oscillation of WA and WAS from positive to negative extreme, the unwinding process, defines this transfer (chart 1 and 2); WA and WAS define intermediate- and long-term sentiment towards stocks.
- Bullishness towards stocks grows as WA and WAS approach their target zones. WA and WAS of -0.71 and -0.50, readings that support downtrends and cause for stocks since November 2014, suggest that distribution is closer to the end than the beginning (chart 1 and 2). This message refutes bearish calls suggesting it's closer to the beginning than end. Cause produces minor and major buying opportunities when WAS falls below 0 and -1, respectively.A WAS close below -0.50 favors the latter.
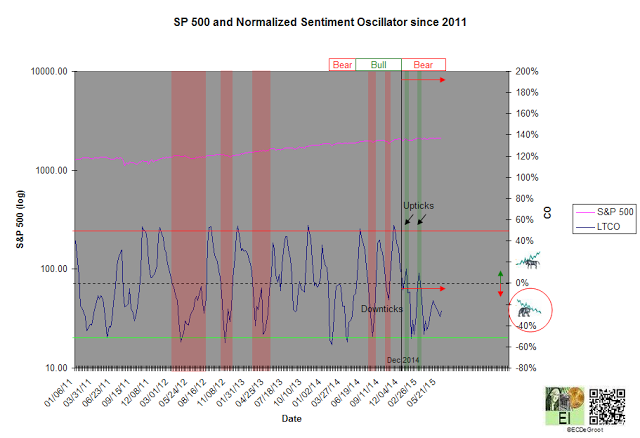
- A negative sentiment oscillator, a down impulse, defines increasing pessimism towards stocks, while a positive trend oscillator, an up impulse, defines increasing optimism. A negative oscillator, opposed by two short upticks, confirms cause building and growing pessimism since December 2014. Stocks bullish bias during cause, the manifesting of strong inflows from Asia, Europe, and emerging markets into US stocks, has supported a running correction for months. This bias, a definite sign of strength (SOS) for stocks consistently displayed during cause since 2009, eludes the majority.
Intermarket Analysis
Composite Timing Indicator (CTI)
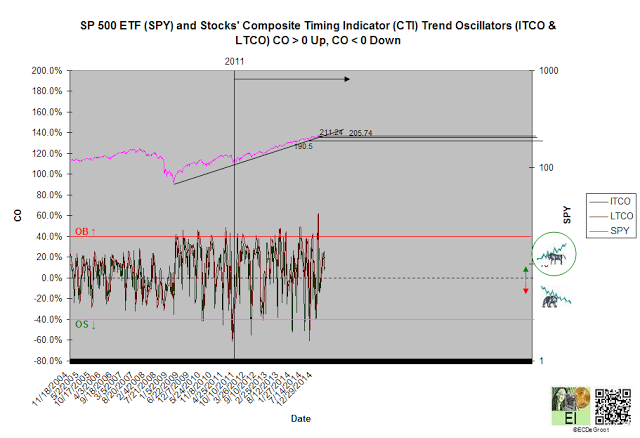
- Positive trend oscillators, a consistent observation since 2011, define an up impulse, bullish bias and unexpected strength with cause (chart 4). This impulse (or series of impulses) has been dismissed by a skeptical majority scarred by 2007-2009 bear market. Stocks relentless rally, a persistent advance yet to produce an obvious entry point for a skeptical majority, will likely force them to buy (chase) at higher prices.
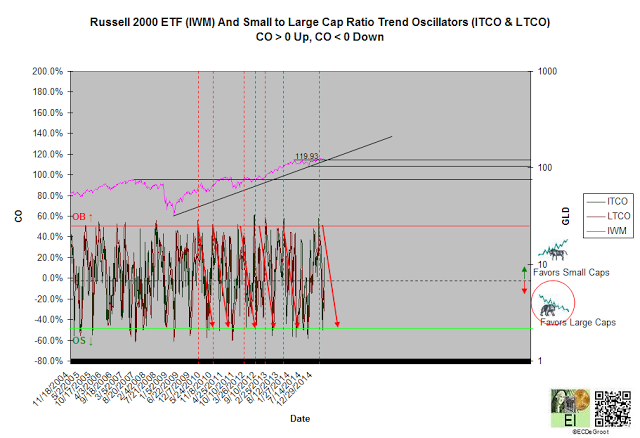
- Small cap stocks, an important leadership group, have outperformed the broader market since November 2014 (chart 5). The small to large cap trend oscillator reached overbought (OB) in March. Since oversold (OS) often follows OB, small caps should continue underpeforming as long as negative trend oscillators define a down impulse.
- Positive trend oscillators define an up impulse that confirms the bullish bias in stocks (chart 6). February's overbought (OB), generated at 211.24 behind an impulse of excessive optimism, should be followed by oversold (OS) eventually. Experience bulls buy OS rather than OB. Chasers that purchased February's OB are still waiting for higher highs in June.

