As long as the US Stock rally defies the logic of the majority, bearish calls will continue growing. The cycle of accumulation and distribution defines cause building within broader mark up that jumped the creek in 2010. Technology stocks (NASDAQ:QQQ), a key leadership sector of the market since 2008, display accumulation under a backdrop of skepticism. This combination favors continued strength despite calls for choppiness for US stocks.
Trend
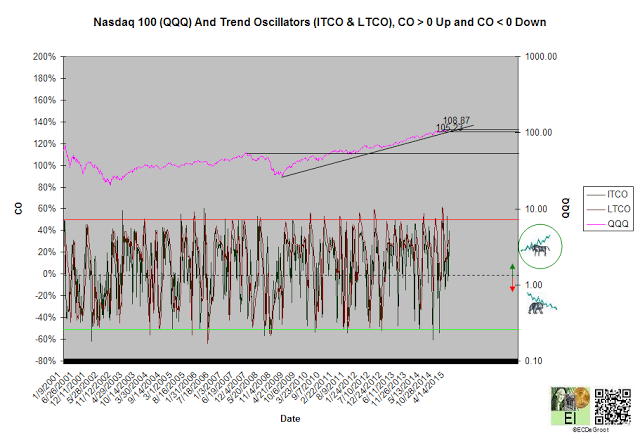
Positive trend oscillators define an up impulse and rally from 104.40 to 109.20 since the second week of February (chart 1). The bulls control the trend until this impulse is reversed.
A close above 108.87-110.04 zone jumps the creek of cause. This correction, more accurately defined as a running correction, has been 'unwinding' sentiment for months.
The unwinding of extreme optimism within cause building, the transfer of ownership in which the minority fades the actions of the majority, has been ongoing since late November 2014, 05/21/15 Review of US Stocks - Sentiment and Intermarket Analysis
If price jumps the creek after a strong energy build, chasers will buy. A close below 105.23 extends cause building.
Chart 1
Leverage
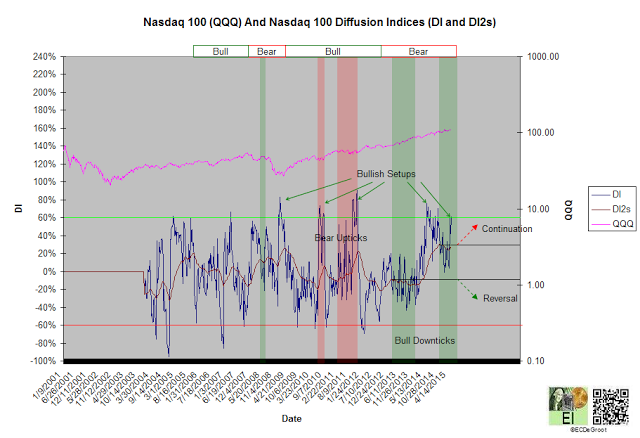
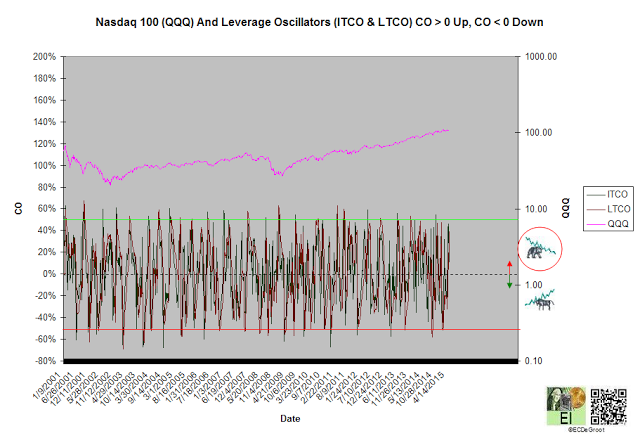
The flow of leverage has defined a bear phase since March 2013 (chart 2). November and last week's bullish setup and leverage's countertrend decline (negative flow) within the bear phase define either a pause in cause building or transition to a bull phase; both are bullish. A DI2 close below its March 2013 low confirms the transition (reversal).
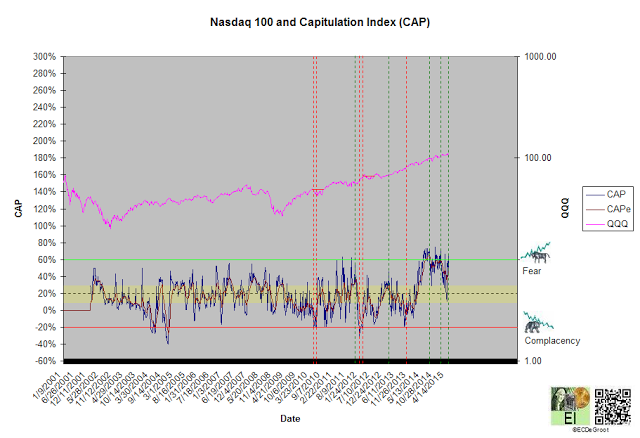
A diffusion Index's (DI) of 62% defines a bullish setup, concentrated accumulation, and sufficient energy stored to jump the creek of cause (chart 2). A capitulation index (CAP) of 65% defines extreme fear and confirms DI (chart 2A). These trends suggest that many of today's bearish calls (google: US stocks will crash) are based more 'beliefs' passing as facts rather than the message of the market.
Chart 2
Chart 2A
Positive leverage oscillators defines an up impulse that supports the bear phase and opposes the bull trend (chart 3). Oscillators would likely turn negative, flip sign, if price jumps the creek of cause (see trend).
Chart 3
Time/Cycle
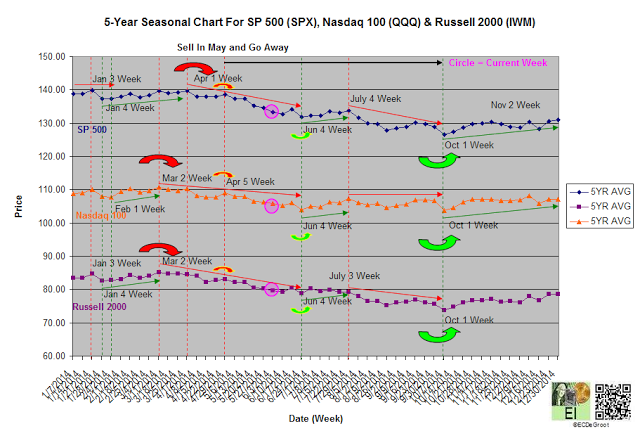
The 5-year seasonal cycle defines weakness until the fourth week of June (chart 4). The April/May or spring transition provides the basis of the old trading adage sell in May and go away. Causing building or good old-fashioned risk-off decline (selloff) until the summer or fall transition is still possible.
Strong international inflows, those fleeing growing uncertainty in Europe, has maintained a 'floor' under stocks for years. This floor has supported a running correction so far.
Chart 4

