Toys R Us refuses to die. The hedge funds that own the debt of the bankrupt toy retailer decided to cancel an auction of assets and instead plan to revive the brand and even open new retail outlets.
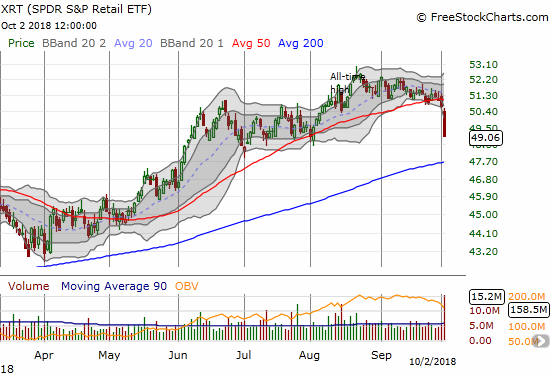
The prospects of another Toys R Us revival could become symbolic: the timing coincided with what looks like a top in retail stocks as represented by the SPDR S&P Retail ETF (NYSE:XRT).
The SPDR S&P Retail ETF (XRT) lost 3.3% and confirmed a 50DMA breakdown. XRT finished reversing all the gains from its last breakout and now sits at a 2-month low.
XRT fell 3.3% on high trading volume to close at a 2-month low. The move confirmed the previous day’s 50DMA breakdown. The resulting reversal of XRT’s last breakout gives the index a very toppy technical pattern. While XRT is back to the consolidation pattern that preceded the breakout, a test of 200DMA support seems highly likely given the intensity of selling. XRT last closed below its 200DMA last November. A 200DMA breakdown would confirm XRT’s top.
If I were still playing my 2018 retail recovery thesis, I would have just sold everything here to lock in profits. I would next resolve to wait until holiday season headlines picked up steam for deciding next sector-wide moves. For now, I went scrambling for headlines trying to assess whether fundamental events agreed with the bearish technicals. Two other events stand out.
First, Amazon (NASDAQ:AMZN) raised its minimum wage to $15/hour and lobbied Congress to raise the national minimum wage from a paltry $7.25/hour. Wall Street hates sharing profits and wage hikes shift a small amount of the loot from shareholders to workers. Moreover, wage increases translate into cost pressures and margin compression – anathema for stock prices.
Second, Stitch Fix (NASDAQ:SFIX), an online retailer which sells customized clothing, was absolutely clobbered after its earnings report completely failed to satisfy investors hopped up on high expectations. The stock closed with a 35.2% loss that is still just a 2-month low. SFIX is a surprisingly sizable component of XRT with a 1% share. The largest holding has a 2.1% share (more on that later).
I have been fascinated by the SFIX story ever since I heard the CEO tell her story. Now I am even more fascinated given the current volatility and a float which is sold 24% short.
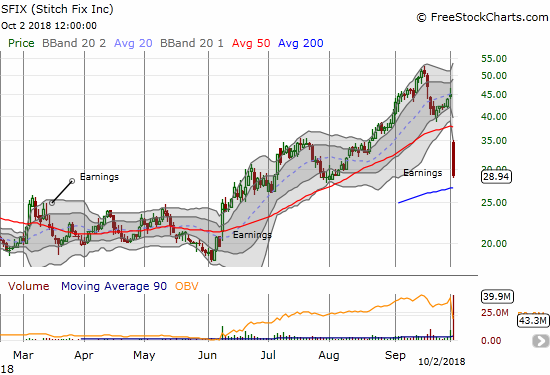
Stitch Fix (SFIX) lost a whopping 35.2% post-earning but is still up 12.0% for the year. A test of 200DMA support is in play.
Carvana (NYSE:CVNA) is the largest holding in XRT with a 2.1% share. This company sells used cars online and delivers them from multi-story vending machines. CVNA dropped 5.2% on the day and broke down below its 50DMA. This 2017 IPO is on a tear and is up 185% year-to-date.
CVNA traded almost down to $8 in 2017. The stock now looks like a short, but short interest is extremely high. I took particular interest in the news events surrounding what looks like a topping pattern in the making around all-time highs: a large owner dumped a significant number of shares, an important competitor made a noteworthy financial deal (I first learned about Shift 2 1/2 years ago in an intriguing talk by the CEO Minnie Ingersoll at Stanford University’s eCorner: “A Drive to Disrupt“), and an analyst upgraded CVNA to outperform right into the teeth of the selling with no effect. A complete reversal of post-earnings gains would confirm the top.
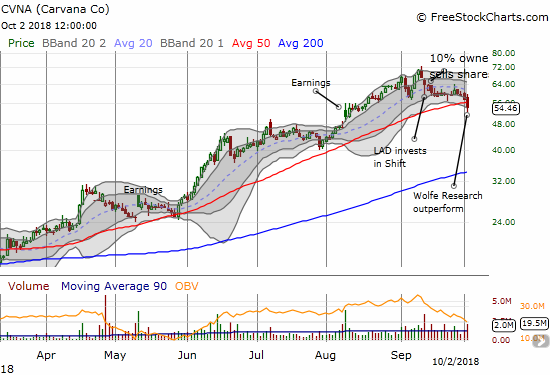
Carvana (CVNA) lost 5.2% and closed below 50DMA support for the first time since early March, 2018.
Surprisingly, Best Buy (NYSE:BBY) does not show up in the top 10 holdings for XRT (cut-off at 1.4% share of assets). Still, the stock’s 4.8% drop and 50DMA breakdown confirmed the weakness in the retail sector. BBY is extremely important to watch here because a test of 200DMA support is in play. BBY last tested its 200DMA in September, 2017. BBY last closed below this support in July, 2016!
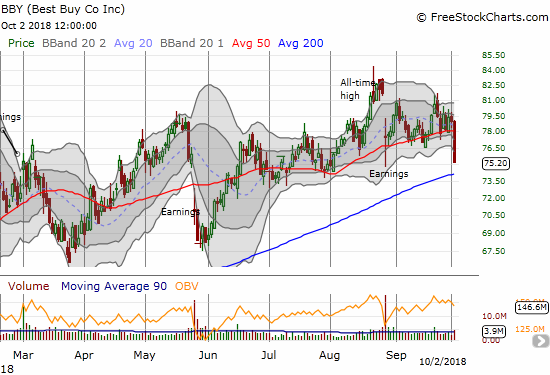
Best Buy (BBY) broke down sharply below 50DMa support and closed at a 2-month low.
Finally, I checked out one of my favorite retail plays: Nordstrom (NYSE:JWN). JWN sold off with the sector to close right at 50DMA support. The price is still too high for me, but I am a buyer if it manages to return to the extended consolidation period that preceded the impressive August post-earnings breakout.
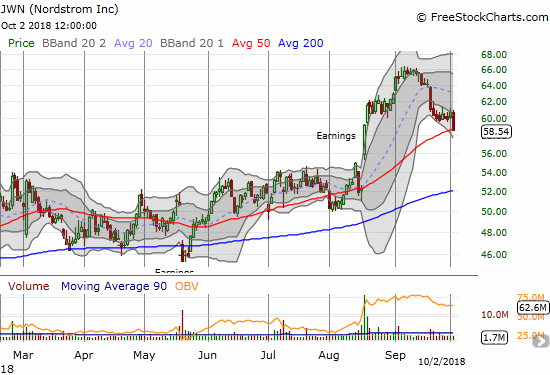
Nordstrom (JWN) lost 3.5% and closed right on top of 50DMA support.
Now retail has joined forces with other indices like small caps and financials to add weight to the anchor loading down the stock market. AT40 (T2108), the percentage of stocks trading above 40DMAs, dropped to a 6-month low at 37.2% even as the S&P 500 (SPDR S&P 500 (NYSE:SPY)) closed flat (still near all-time highs) and the volatility index, the VIX, also closed flat. Losing retailers to a fresh sell-off like the one in 2017 would make me doubt the underlying health of the consumer and the stock market as a whole given home builders have struggled for most of 2018. Stay tuned…
Be careful out there!
Disclosure: long SPY calls, long UVXY calls

