Why is the AUD index making new trend highs? Do you really understand the type of risk profile that is dominating proceedings at this stage? If you do, you probably joined me rising AUD/JPY longs yesterday. Were you able to catch other recent trade setups available in the Forex market in the last 24? Today's report touches on all these points and much more...
The Daily Edge is authored by Ivan Delgado, 10y Forex Trader veteran & Market Insights Commentator at Global Prime. Feel free to follow Ivan on Twitter & Youtube weekly show. You can also subscribe to the mailing list to receive Ivan’s Daily wrap. The purpose of this content is to provide an assessment of the conditions, taking an in-depth look of market dynamics - fundamentals and technicals - determine daily biases and assist one’s trading decisions.
Let’s get started…
- Quick Take
- Narratives in Financial Markets
- Recent Economic Indicators
- Dive into Pro FX Chart Insights
Quick Take
The new trend high in the AUD index tells us where we stand in the US-China trade deal saga, with optimism reigning again on the back of a headline by China’s Commerce Minister stating that it has reached a compromise with the US “in principle” to cancel some of the existing tariffs. It didn't really matter that Bloomberg and Reuters came out with conflicting reports about the veracity of the news, the market never looked back. Testament of the funky mood can be seen in the punchy moves in both the S&P 500 (new all-time highs) and the US 30-year bond yield (at one stage more than 5% higher), reinforcing the thematic of 'true risk on' in the market place. This environment is also supporting the likes of the New Zealand Dollar, piggybacking the rise in the AUD, which in turn followed the appreciation in the Yuan as the #1 proxy. The USD remains well bid up across the board, with the exception of the weakness shown against the Oceanic currencies. The Canadian Dollar has not attracted as much buy-side flows but still capitalized n the groovy vibes towards beta-currencies by showing a combatant stance against funding currencies. These latter group (JPY, CHF, EUR) felt the pressure of the thriving risk appetite dynamics in the market, making new lows at an index level, while the GBP loss value again as the BOE sees two dissenters championing for a cut, and to make matters worse, the Tories start to see the lead in the polls dropping ahead of the general election next month.
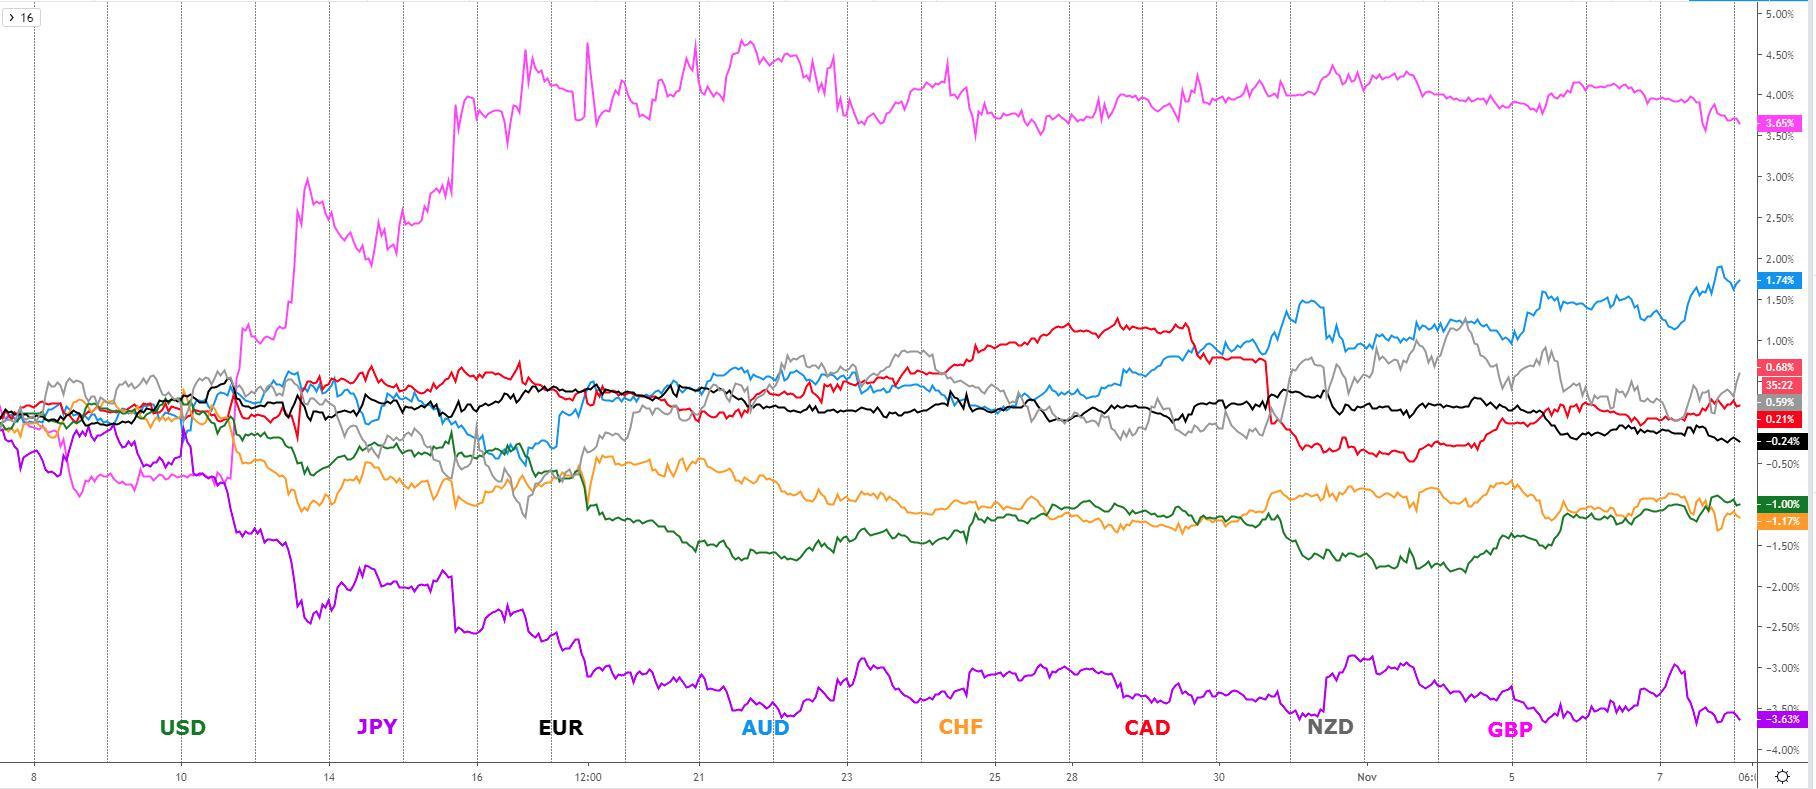
The indices show the performance of a particular currency vs G8 FX. An educational video on how to interpret these indices can be found in the Global Prime's Research section.
Narratives In Financial Markets
* The Information is gathered after scanning top publications including the FT, WSJ, Reuters, Bloomberg, ForexLive, Institutional Bank Research reports.
Renewed optimism on US-China trade: The pendulum in the US-China trade deal semantics has swung full extension towards the optimistic side as China’s Commerce Minister states it has reached a compromise with the US “in principle” to cancel some of the existing tariffs, although some other reports deny the US is fully convinced to take such steps. If it does, it would represent a breakthrough that goes beyond what the market had been preparing for, which is simply a truce with minor concessions.
China's MoC revives positive vibes: China's Commerce Ministry spokesperson stated, right ahead of the London open: “Both sides should roll back existing additional tariffs in the same proportion simultaneously based on the content of the agreement…This is what [the two sides] agreed on following careful and constructive negotiations over the past two weeks”.
Trump feels the political pressure: Since Trump is starting to feel the growing pressure from diminishing electorate support as tariffs take a major toll on businesses, the line of thinking is that he is willing to do whatever it takes to get a deal done, including a rollback in tariffs. The strategy team at NAB notes: “In the US, state governor races revealed potential re-election problems in suburban America. Kentucky and Virginia went Democrat, while the blue collar parts of Pennsylvania swung Democrat and a county in Delaware was won by the Democrats."
No trust between sides remains a risk: FOX Business Edward Lawrence, in a tweet, detailed that “according to Chinese trade sources: China wants all tariffs rolled back as phases of the #trade deals are completed. Those sources say the US offered to roll back some tariffs but want to keep the majority in place until the Chinese reach certain milestones after the full trade deal is completed.” The more objections that exist, which comes down to a matter of not trusting each other, yet still forced to negotiate.
Juncker asserts market no auto tariffs: The fact that EU’s Juncker seemed certain that no auto tariffs on EU cars will be applied, reinforces the notion that the Trump administration is no longer in a position to keep flexing its muscle on tariffs as it used to if it wants to maintain the electorate support from the people. Juncker said “he won’t do it…you are speaking to a fully informed man”.
Risk appetite through the roof: The risk-weighted index, which monitors the S&P 500 and the US 30y bond yields, as the ultimate barometer to assess how cheap or expensive risk sensitive currencies are, has gone absolutely ballistics as equities in the US (S&P 500) print fresh record highs while the US yields show a very impressive run to the upside as safe haven bids are abandoned.
Chinese Yuan appreciation: As a result of the renewed optimism, the USD/CNH pair, as another clear risk barometer that depicts the outlook around the trade deal prospects, has broken below the psychological 7.00 handle, all the way down to 6.97, fueling along the way demand for the AUD as a proxy.
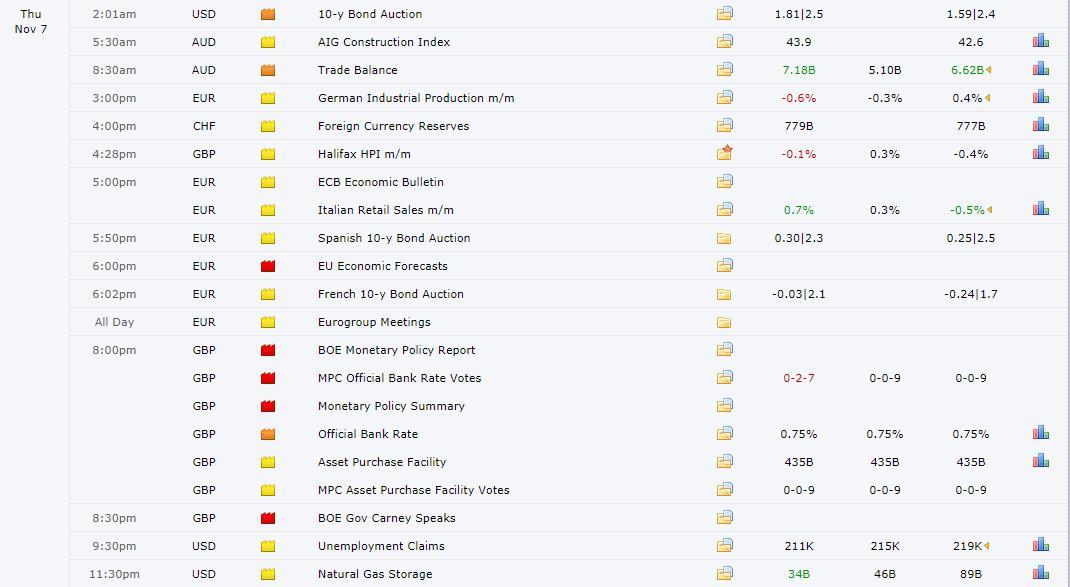
BoE sees more dissenters: Two out of nine members at the BOE are now endorsing a cut in what represents the most divided board since June 2018. This added downside pressure to the GBP. As part of BoE Governor Carney press conference, he said “if downside risks emerge to UK economy there may be a need to provide reinforcements, but this is not pre-committing.” In other words, Carney has stressed further the possibility of rate cuts on a more pronounced slowdown in the UK. Besides, the latest YouGov polls show Conservative party lead dropped as Lib Dem pick up momentum, which is a development that fueled the downside pressure in the GBP.
RBA sticks to script, lowers GDP forecast: The latest RBA statement on monetary policy notes that further easing could convey 'overly negative' view on the economy, even if they also state “board prepared to ease if needed.” Additional headlines included that “holding rates in Nov allows time to 'assess effects'”, while confirming that the December GDP was lowered to 2.25% from 2.50%.
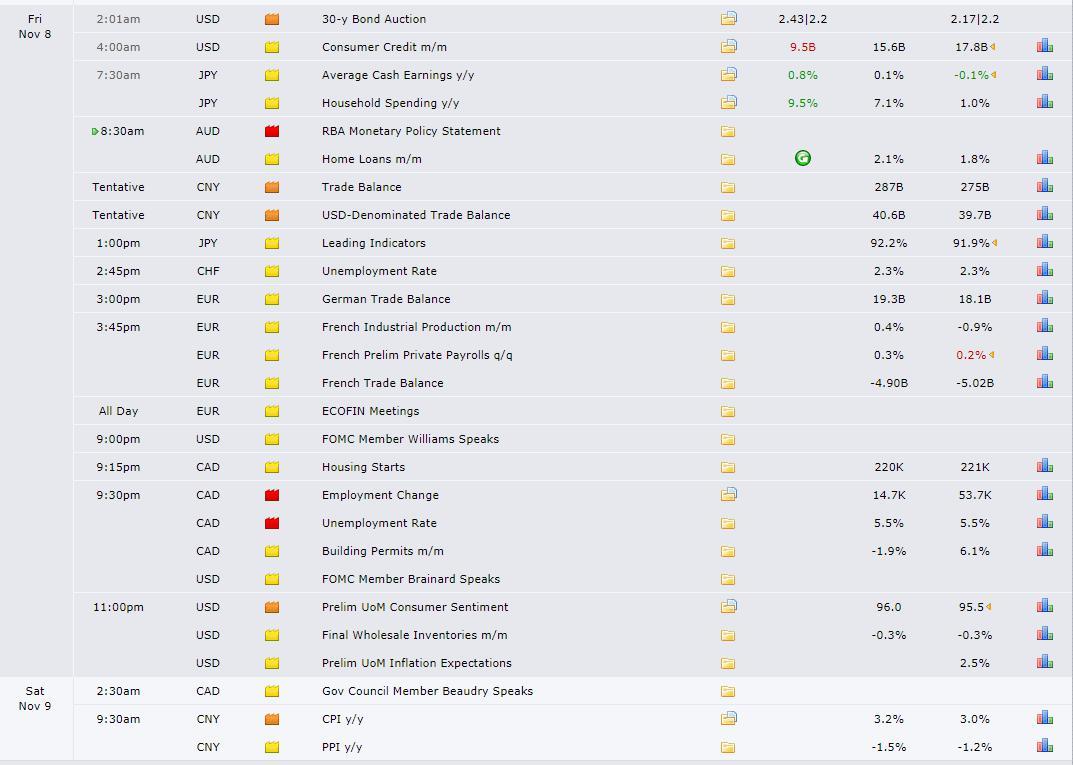
Recent Economic Indicators & Events Ahead
Source: Forexfactory
Professional Insights Into FX Charts
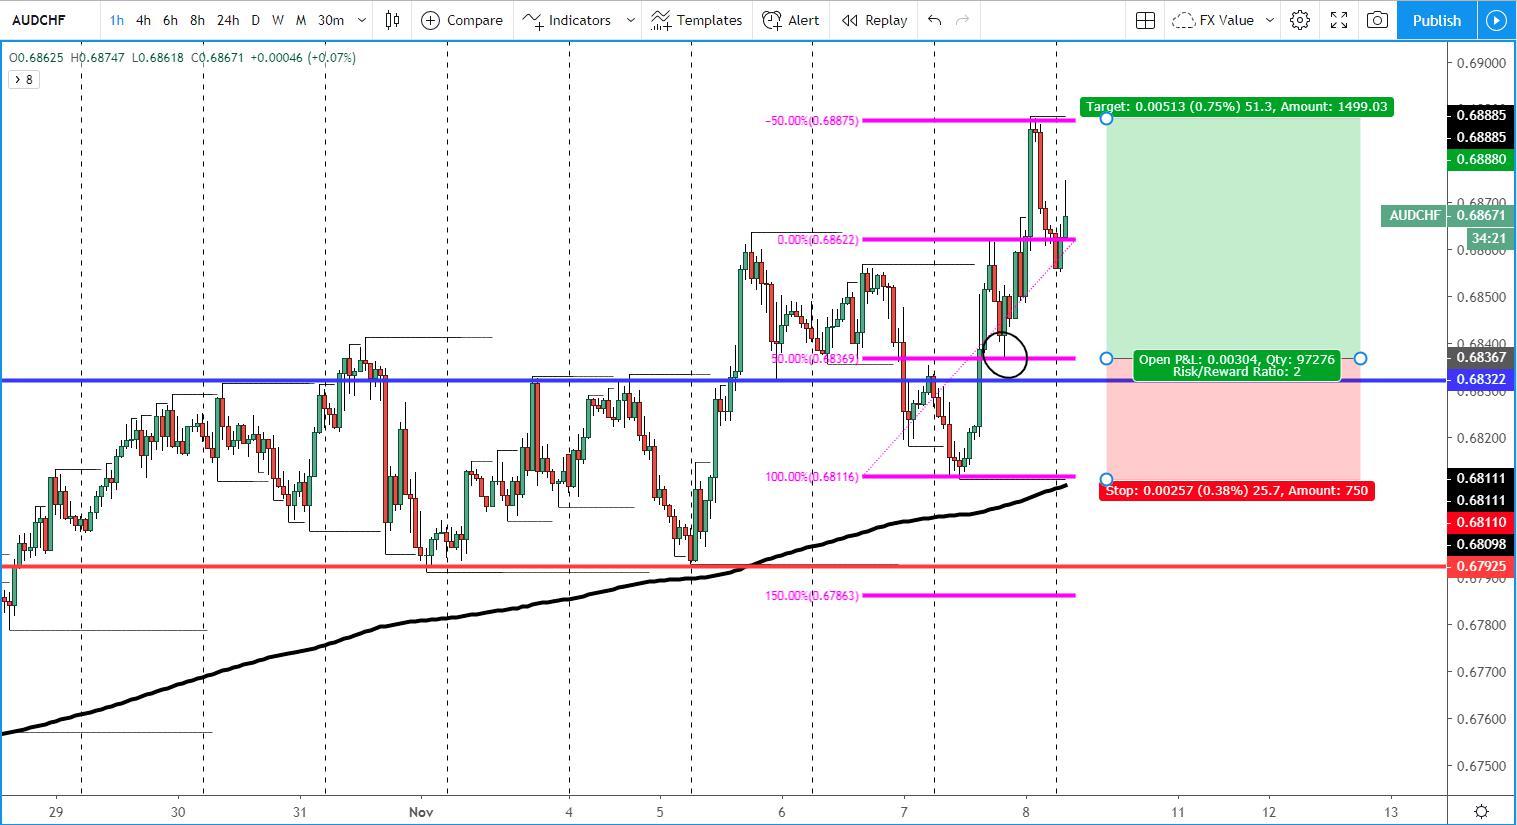
AUD/CHF exhibited a long trade setup in the last 24h in line with the upward tendencies it has displayed in recent weeks. The initial drop in AUD value served the purpose of filling out long contracts at a more advantageous price before a powerful snap back up that broke the bearish structure. The retest of the prior swing high led to an immediate rejection (entry point), targeting with surgical precision the 50% measured move area to take profits.
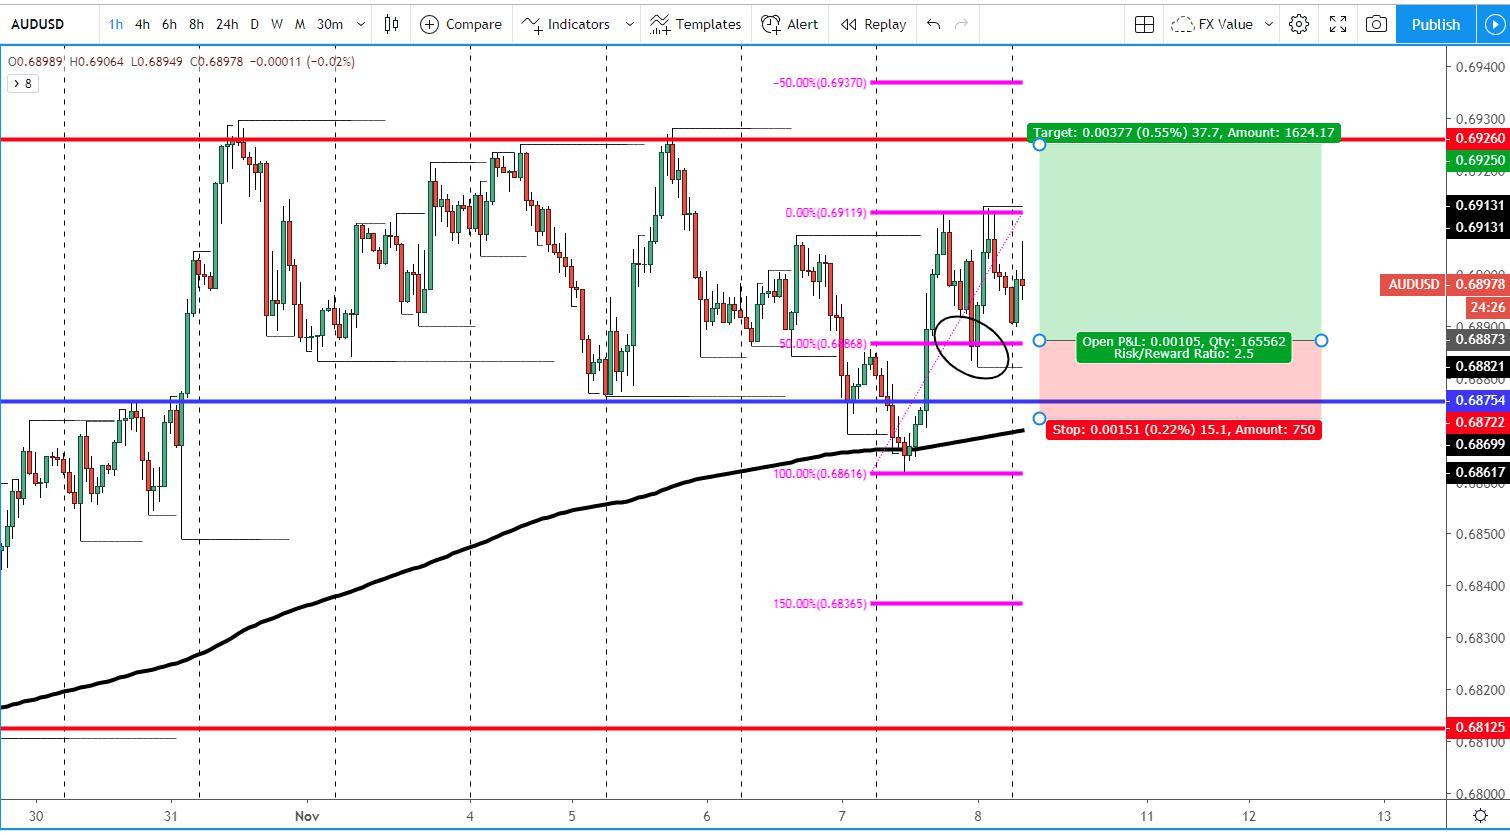
In a very similar manner, the bullish run in the AUD through the last European session, allowed to buy the currency against the USD on dips (see circle for entry) once US came online. So far, the trade has yielded a move to break even, with a move up to 0.6925 (top of the range) expected should further positive headlines in the US-China trade fuel the sentiment. Even if one only isolates the technical merits, this is a market that looks destined to test the opposite liquidity-rich area after collecting long-sided contracts low in the range after an initial fake out.
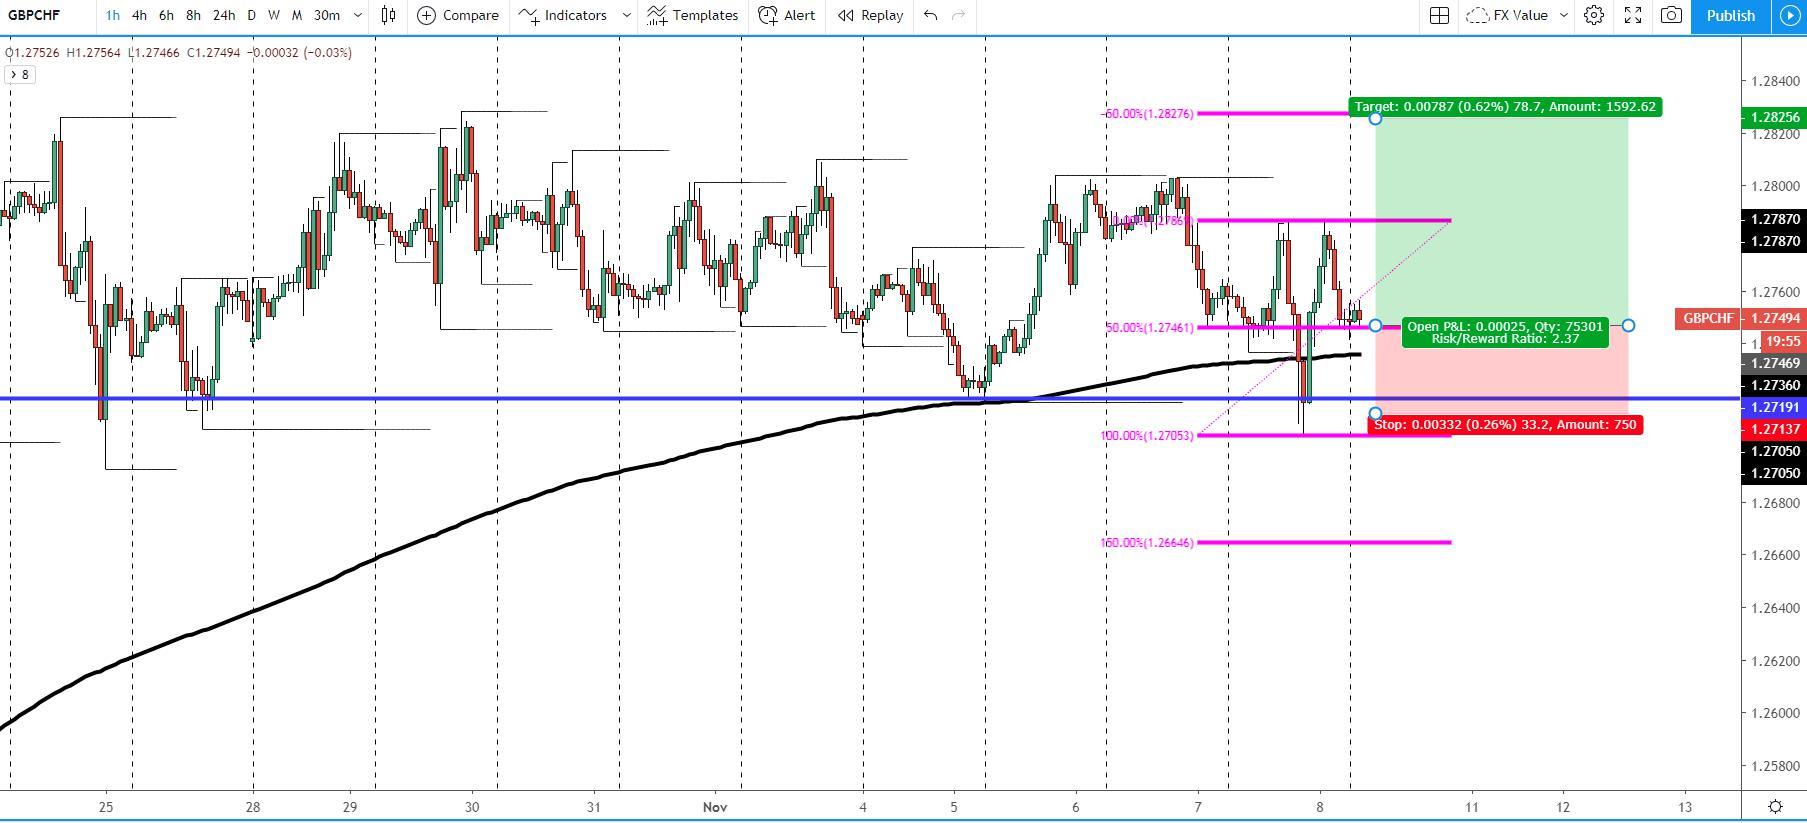
GBP/CHF has also tested a level of key liquidity below a support line in the H4 chart, where a clear failure to find lower levels has eventuated. From there, the initiation of a strong buy-side campaign to take the market in the opposite direction has occurred, trapping those induced to short the market, and so the rationale I apply in these cases is that a retest of the 50% retrac should attract mounting number of bids to take this market much higher from here.
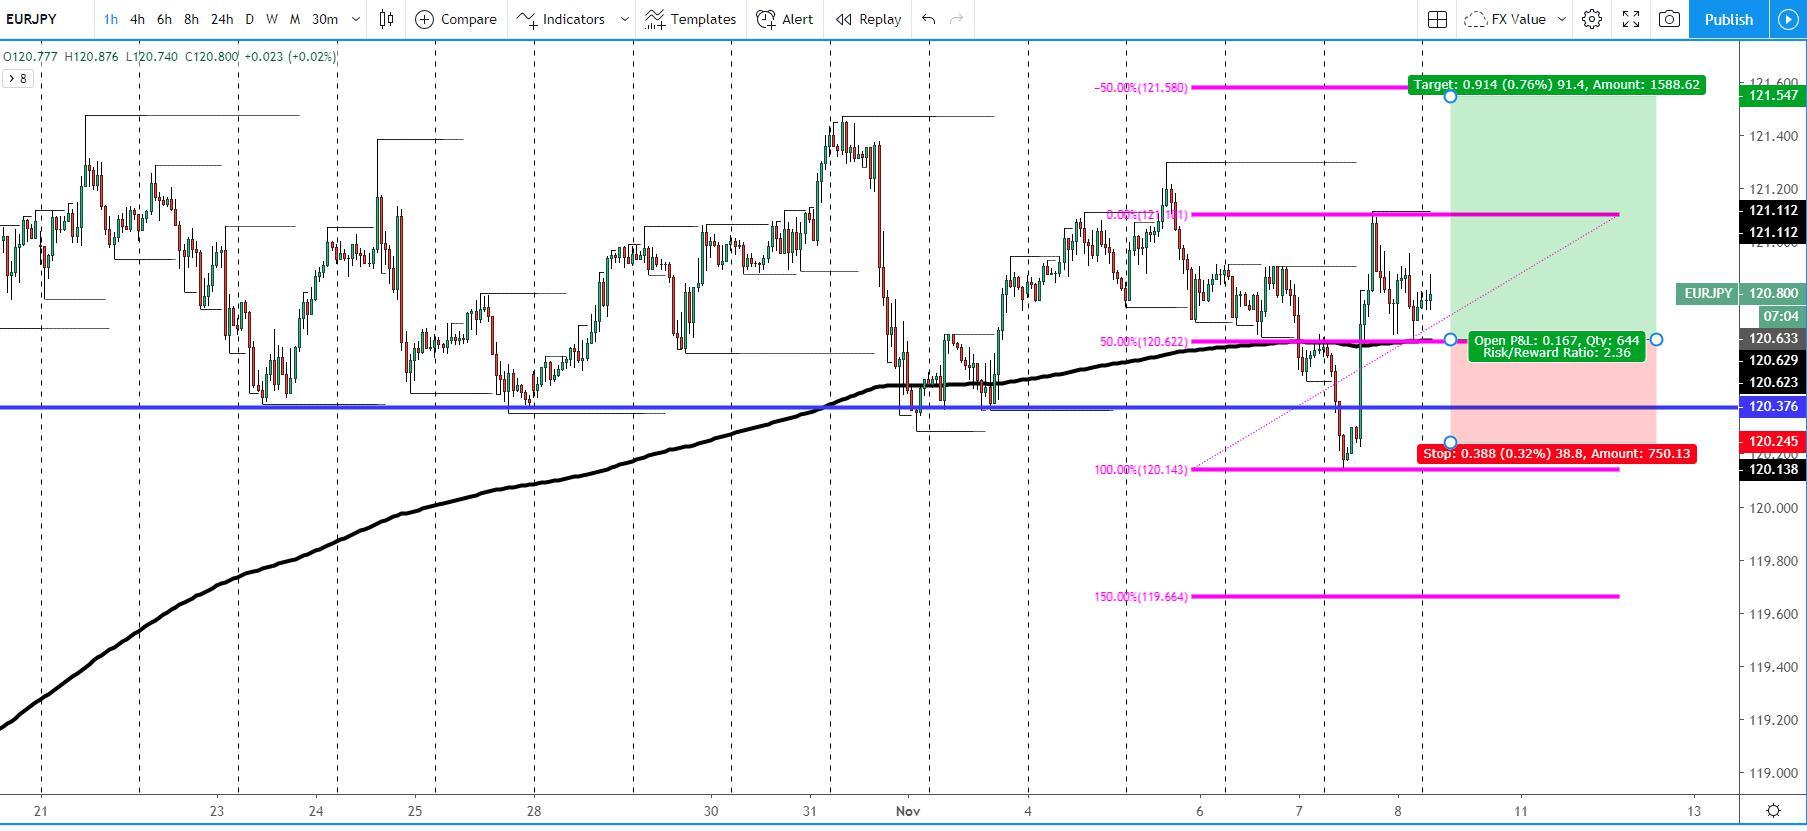
A final market to bring to the readers’ attention where a long position could have been initiated includes the EUR/JPY. The pattern manifested, part of the ‘trapped traders’ educational concept I am teaching via my LIVE shows, suggests that this market runs the risk of heading higher in the coming days after a breakout of a major LPs (liquidity providers) area, also known as support, got rejected with huge impetus towards the opposite direction. This makes me a buyer on dips at the 50% retrac, aiming for a 50% measured move target.
Important Footnotes
- Risk model: The fact that financial markets have become so intertwined and dynamic makes it essential to stay constantly in tune with market conditions and adapt to new environments. This prop model will assist you to gauge the context that you are trading so that you can significantly reduce the downside risks. To understand the principles applied in the assessment of this model, refer to the tutorial How to Unpack Risk Sentiment Profiles
- Cycles: Markets evolve in cycles followed by a period of distribution and/or accumulation. To understand the principles applied in the assessment of cycles, refer to the tutorial How To Read Market Structures In Forex
- POC: It refers to the point of control. It represents the areas of most interest by trading volume and should act as walls of bids/offers that may result in price reversals. The volume profile analysis tracks trading activity over a specified time period at specified price levels. The study reveals the constant evolution of the market auction process. If you wish to find out more about the importance of the POC, refer to the tutorial How to Read Volume Profile Structures
- Tick Volume: Price updates activity provides great insights into the actual buy or sell-side commitment to be engaged into a specific directional movement. Studies validate that price updates (tick volume) are highly correlated to actual traded volume, with the correlation being very high, when looking at hourly data. If you wish to find out more about the importance tick volume, refer to the tutorial on Why Is Tick Volume Important To Monitor?
- Horizontal Support/Resistance: Unlike levels of dynamic support or resistance or more subjective measurements such as fibonacci retracements, pivot points, trendlines, or other forms of reactive areas, the horizontal lines of support and resistance are universal concepts used by the majority of market participants. It, therefore, makes the areas the most widely followed and relevant to monitor. The Ultimate Guide To Identify Areas Of High Interest In Any Market
- Trendlines: Besides the horizontal lines, trendlines are helpful as a visual representation of the trend. The trendlines are drawn respecting a series of rules that determine the validation of a new cycle being created. Therefore, these trendline drawn in the chart hinge to a certain interpretation of market structures.
- Fundamentals: It’s important to highlight that the daily market outlook provided in this report is subject to the impact of the fundamental news. Any unexpected news may cause the price to behave erratically in the short term.
- Projection Targets: The usefulness of the 100% projection resides in the symmetry and harmonic relationships of market cycles. By drawing a 100% projection, you can anticipate the area in the chart where some type of pause and potential reversals in price is likely to occur, due to 1. The side in control of the cycle takes profits 2. Counter-trend positions are added by contrarian players 3. These are price points where limit orders are set by market-makers. You can find out more by reading the tutorial on The Magical 100% Fibonacci Projection
