In previous installments of replicating indexes I profiled the style-analysis methodology and presented an example using a hedge fund index. Now let’s turn to a strategy of replicating the S&P 500 Index with a handful of stocks that are considered socially responsible investments (SRI).
What’s the rationale? A growing number of investors require that their equity portfolios match certain ethical and/or moral standards. Marrying SRI standards with money management can be challenging, however, in part because earning a reasonable return doesn’t always align with pursuing a social good, at least not perfectly. One way to bridge the gap is by selecting a group of investments that pass muster for a particular set of SRI criteria and then optimizing the weights of those investments so that they match the risk and return profile of an acceptable market index. The goal, in short, is investing with your SRI standards intact while tracking a benchmark with favorable financial attributes — the best of both worlds for an SRI investor.
As an example, let’s imagine an investor who wants to own the S&P 500 Index via SPDR S&P 500 ETF (NYSE:SPY). But some of the constituent companies run afoul of her SRI standards. The solution: integrate the SRI criteria with SPY’s risk/return profile by fusing the two into one strategy via statistical decomposition using style analysis.
The first step is defining the SRI portfolio. There are several databases that screen companies. You could also come up with your own filter. For this test, let’s use ten stocks recently cited by the Hiring Success Journal. In July, the site published a list of 20 companies “demonstrating a diverse range of social responsibility goals and initiatives.” Ten of the firms are publicly traded stocks, including General Electric (NYSE:GE), IBM (NYSE:IBM), Starbucks (NASDAQ:SBUX), and Apple (NASDAQ:AAPL). We can, of course, use any list we find appropriate, but for now let’s stick with this set.
The challenge is trying to replicate SPY’s return and risk characteristics using only these ten stocks. The procedure for this test: run optimization analysis once a year to decompose SPY’s attributes and create a portfolio using the ten stocks in the recommended weights to minimize tracking error relative to the ETF. In this case I used the quadratic programming method. Here’s a basic setup I wrote using R code for a one-period analysis.
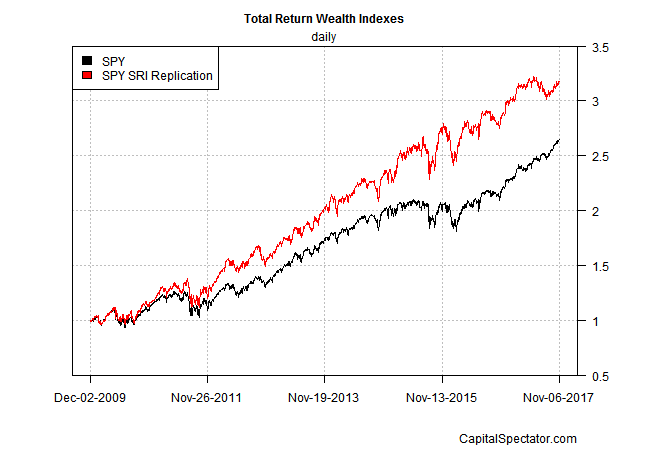
The resulting wealth indexes for the SPY and SPY SRI Replication portfolios are shown in the chart below for daily data from Dec. 2009 through yesterday (Nov. 6, 2017). It’s clear that SPY SRI Replication outperforms SPY. Outperformance is welcome, but if the replication beats its target by a wide degree the opposite is possible too and so we need to take a closer look at the results to determine if the effort is flawed.

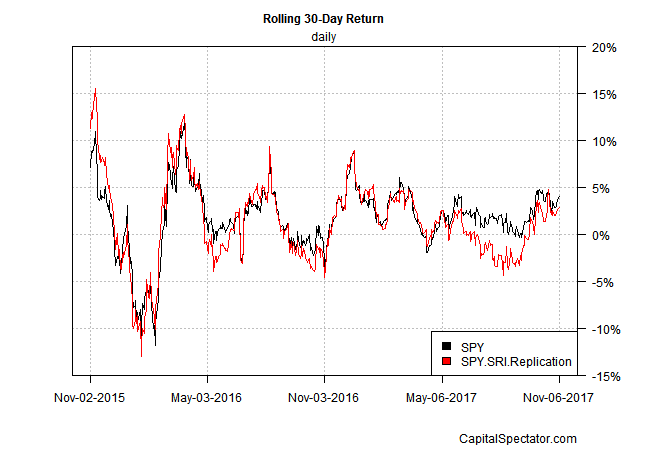
In fact, the first approximation for replicating SPY looks reasonable when we review the 30-day rolling returns for the two wealth indexes. Although the match isn’t perfect, it’s close. Indeed, the correlation for the rolling 30-day returns in the next chart below is a high 0.93, which is close to a perfect correlation of 1.0.

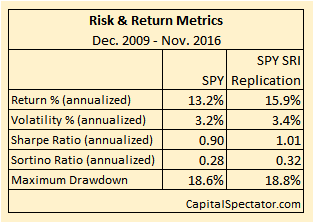
Note, too, that the goal of replicating SPY with the 10-stock portfolio looks pretty good via a select number of metrics, as shown in the table below. The SPY SRI Replication strategy isn’t flawless, but it’s close enough to inspire confidence that holding this group of 10 stocks, in the weights recommended by the style-analysis optimization, will bring you close to an S&P 500 investment.

We can, of course, go deeper and try to minimize tracking error further. For instance, the example above rebalances the portfolio once a year; doing so more frequently could enhance the replication results. Perhaps adding another stock or two that meets the investor’s SRI criteria would help too.
Meantime, the fact that this toy example does a reasonable job of replicating SPY with ten stocks highlights the possibilities for customization. Indeed, almost any SRI criteria can be used. Ditto for the target index. Replicating a small-cap and/or a value equity index with a set of SRI criteria are practical alternatives, for instance.
There are limits, of course. The choice of stocks will determine how closely an index will be replicated and how the returns stack up. In the toy example reviewed, the ten stocks selected just happened to be strong performers for the sample period, which is why the replication results beat SPY while still offering a comparable risk profile. Another set of ten stocks that suffered relatively poor performance, by contrast, would likely trail SPY.
Keep in mind, too, that all the usual investing caveats apply with respect to diversification. For instance, if the goal is approximating SPY’s risk profile, we must be careful to hold a reasonably diverse set of companies to avoid excessive concentration in a sector.
The main lesson, however, is encouraging. Building a portfolio that matches an investor’s particular SRI objectives while more or less tracking a target index opens the door to a wide range of customization possibilities.
