Index Futures Net Changes and Settlements:

Foreign Markets, Fair Value and Volume:
- In Asia 7 out of 11 markets closed lower: Shanghai Comp -0.19%, Hang Seng +0.13%, Nikkei -0.51%
- In Europe 9 out of 13 markets are trading higher: CAC +0.09%, DAX +0.40%, FTSE +0.07%
- Fair Value: S&P +4.31, NASDAQ +26.87, Dow +6.71
- Total Volume: 1.4 million ESU & 212 SPU traded in the pit
*As of 7:00 a.m. CST
Today’s Economic Calendar:
Today’s economic calendar includes MBA Mortgage Applications 7:00 AM ET, Durable Goods Orders 8:30 AM ET, International Trade in Goods 8:30 AM ET, Retail Inventories [Advance] 8:30 AM ET, Wholesale Inventories [Advance] 8:30 AM ET, State Street (NYSE:STT) Investor Confidence Index 10:00 AM ET, and the EIA Petroleum Status Report at 10:30 AM ET.
S&P 500 Futures: Down But Not Out

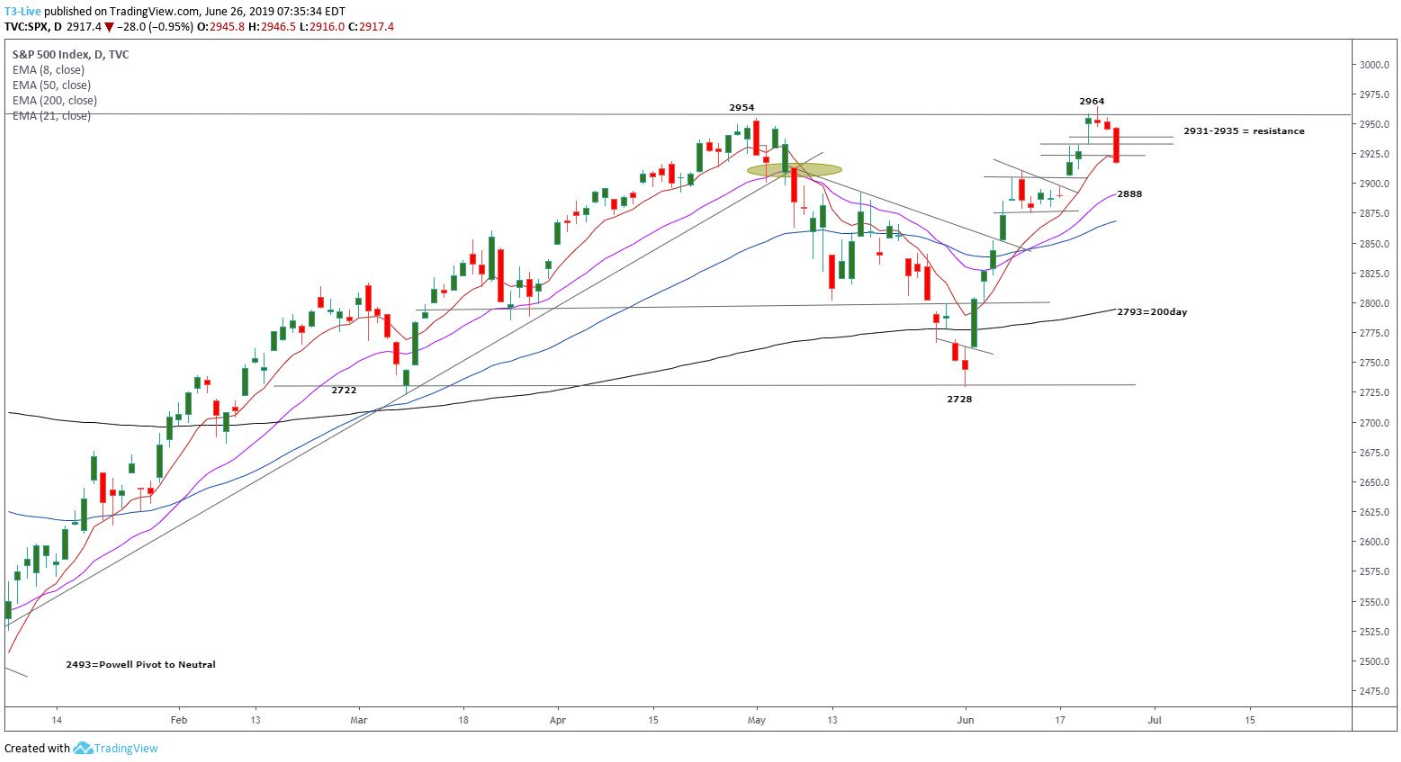
Chart courtesy of Scott Redler @RedDogT3 – $spx futures +15 as Mnunchin repeats the 90% US/China Trade headline. See if the 2930-2935 area gets rejected or reclaimed.
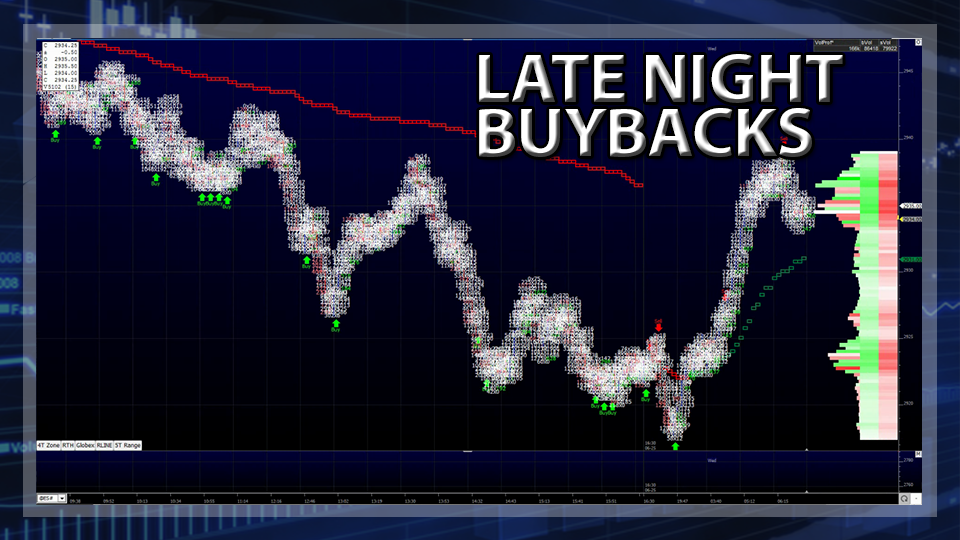
After trading down to 2942.25 during Monday nights Globex session, the S&P 500 futures (ESU19:CME) rallied to open Tuesday’s regular trading hours at 2951.00.
The ESU turned weak right out of the gate after the 8:30 CT bell, and broke down to a new low at 2940.50 in the first 15 minutes of trading.
After a little back-and-fill up to 2945.50, the weakness persisted, and the futures continued to print new lows, first trading down to 2936.00, then 2926.75, then 2921.00, and eventually down to 2920.00 when the MiM reveal showed $430 million to buy.
The ESU then went on to print 2922.00 on the 3:00 cash close, and 2922.25 on the 3:15 futures close, down -30 handles on the day.

