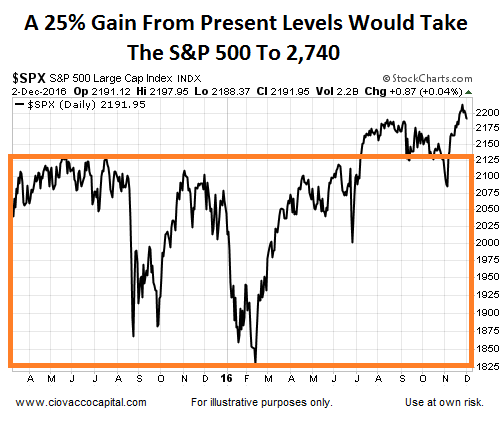
Positive Returns 97% Of The Time
Based on current readings of their “sell side indicator”, Bank of America/Merrill Lynch (BOAML) recently wrote in a research note to clients:
“Historically, when our indicator has been this low or lower, total returns over the subsequent 12 months have been positive 97% of the time, with median 12-month returns of +25%,”

Recommended Stock Allocations Remain Low
The BOAML indicator is based on the recommended stock allocations inside portfolios. A typical benchmark equity allocation is 60%-65% of a portfolio. Presently, the recommended allocation is significantly below that range, coming in at 51%. If the recommendations moved back to the historical mean, as they typically do, money would continue to flow out of bonds and into stocks. More information about the BOAML signal can be found on Yahoo Finance.
A Separate Rare Signal Also Leans Bullish
Has any other longer-term signal appeared recently that aligns with the possibility of double-digit stock gains over the next 12 months? Yes, this week’s stock market video covers a monthly S&P 500 momentum and trend signal that has occurred less than 10 times over the past 23 years. The signal was triggered at the end of November. Even more importantly, the signal was also triggered recently in numerous risk-on ETFs, such as small-caps (iShares Russell 2000 (NYSE:IWM)), mid-caps (SPDR S&P MidCap 400 (NYSE:MDY)), energy (Energy Select Sector SPDR (NYSE:XLE)), copper (iPath Bloomberg Copper Subindex Total Return Exp 22 Oct 2037 (NYSE:JJC)), materials (Materials Select Sector SPDR (NYSE:XLB)), and the total stock market (Vanguard Total Stock Market (NYSE:VTI)), which may be due in part to allocation shifts based on President-elect Trump’s platform. Bearish signals have been triggered in defensive assets such as bonds (iShares 20+ Year Treasury Bond (NASDAQ:TLT)), utilities (Utilities Select Sector SPDR (NYSE:XLU)), consumer staples (Consumer Staples Select Sector SPDR (NYSE:XLP)), and healthcare (Health Care Select Sector SPDR (NYSE:XLV)), which may be due in part to post-election shifts regarding growth, earnings, taxes, deficits, and inflation.
If you do not feel the signals outlined in the video are helpful, there is an easy solution…you can choose to ignore them and continue to make decisions based on your own criteria.
How Can These Signals Help Us?
Since there is no such thing as a perfect signal or indicator, the material covered in the video above and the BOAML indicator help us in two ways: (1) to better understand the probabilities of good things happening relative to bad things happening, and (2) to remain open to all outcomes, even better than expected outcomes given the market’s trendless and whipsaw pattern over the past 2-3 years.
The Weight Of The Evidence
Have any other signals occurred recently that align with the signals presented above? Yes, in recent months we have covered another rare trend signal, an extremely low volatility reading, and breakouts from long-term consolidation patterns.
Since the future is unknown and markets can do anything at any time, as always, we will remain open to all outcomes, including bearish outcomes. The data we have in hand aligns with a favorable risk-on environment; if the data deteriorates, we will make the necessary defensive adjustments.
These Signals Are Based On Facts
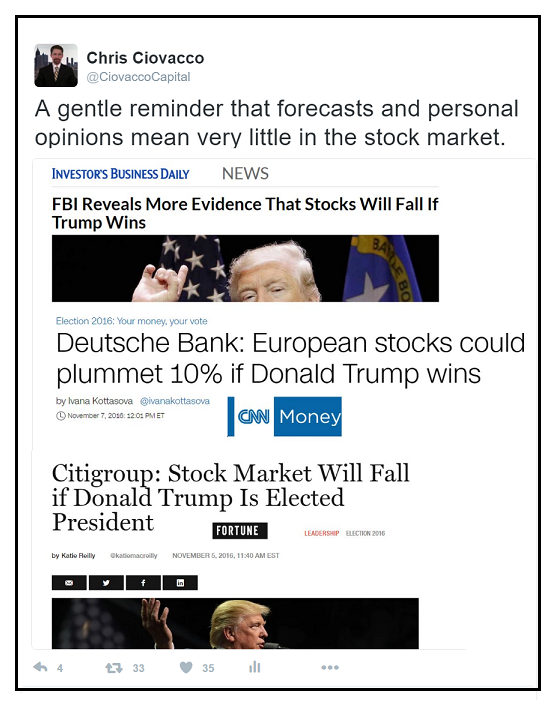
As noted in the tweet below, recent events (Brexit, U.S. election) remind us to take any forecast or opinion with a necessary grain of open-minded salt. The BOAML indicator and the broad array of recent monthly bullish MACD signals are based on facts, rather than opinions or forecasts. BOAML has historical data they can compare to present facts in hand. The MACD crosses presented in the video above are observable facts that can also be compared to historical facts, which is quite a bit different than an opinion or forecast of something that may or may not happen. If the facts change, the historical interpretation of the facts will change as well. Time will tell.

