US REITs
A year ago we featured “REITs in Ruins”. Our research found that Hotel/Resort/Leisure REITs were knocked down the hardest, surprising nobody, and that Industrial/Specialty REITs held up respectably. We have occasionally checked in on this group of stocks since then.
Today, REITs are richly valued and have become a re-opening play. How does that narrative stand today considering supply shortages and inflationary concerns? We see REITs benefitting from a slump in new building, positive relative value, and light investor allocations.
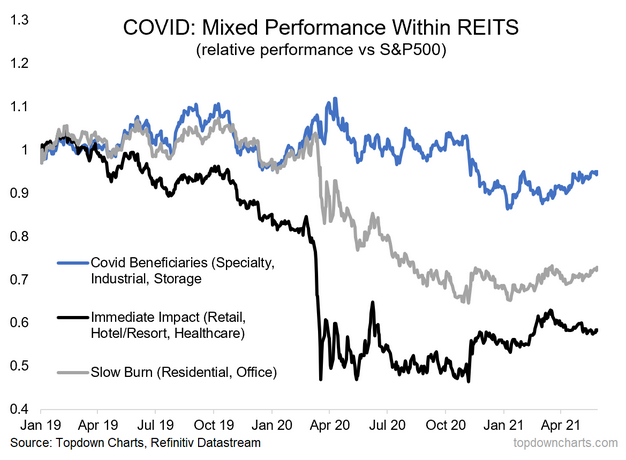
Featured Chart: Separating US REIT Winners and Losers
One of the x-rays we performed on US REITs was breaking out the group into three categories: COVID beneficiaries (Specialty, Industrial, and Storage REITs), those that were immediately impacted the hardest (Retail, Hotel/Resort, Healthcare), and lastly the “Slow Burn” group (Residential and Office REITs). The worst-hit cohort has underperformed recently even with positive headlines regarding the US COVID situation and the updated relaxed CDC guidance. Despite tailwinds such as a rebound in rents and the weighted average cost of debt creeps lower, it remains a tough slog for US REIT investors.

Valuations
US commercial property prices have surged well beyond the long-term average. Adjusted for inflation, commercial property is above the 2007 and early 2020 high. That strength lent itself to US REITs turning quite expensive on a nominal basis. Our composite valuation indicator flashes red on the screen—US REITs are nearly 2 standard deviations above their long-term average—that’s higher than was seen at the peak of the US housing boom of 2006-2007. The very high z-score should concern long-term investors in the space. In the near term, however, we are more bullish.
Tailwinds
US REITs feature a yield premium of about 1% over US Treasuries and the S&P 500. There is a small positive spread versus US investment grade debt, too. The yield gap could be pressured if market rates rise further, but at the moment US REITs are somewhat attractively valued on a relative yield basis. Another positive for the space is what’s happening with construction activity. Non-residential real estate investment as a percent of GDP is at a record low which could further pressure supply (bullish for REITs).
REIT ETFs: Not Much Curb Appeal Yet
REITs have not gained much traction relative to the performance of the S&P 500. From the February 2020 peak, the SPDR® S&P 500 ETF (NYSE:SPY) has returned about 25% while the US REITs ETF the Vanguard Real Estate Index Fund (NYSE:VNQ) is fractionally positive and ex-USA REITs via the Vanguard Global ex-U.S. Real Estate Index Fund (NASDAQ:VNQI) is fractionally negative. The The Real Estate Select Sector SPDR Fund (NYSE:XLRE) ETF has returned 6%. Even since the market shifted to value and the re-opening trade last November, REITs as a whole have simply matched SPY’s return.
Investor Allocations
With the COVID crash so recent in our minds and lukewarm REIT performance, it comes as no surprise that implied allocations to the area are low. Our data shows a 1% position in REITs among US ETFs—compare that to the 2013, 2015, and 2016 peaks just shy of 2.5%. We saw a sharp in the first half of 2020 which has yet to be recovered.
Our View
US REITs were the bright spot of the market for a short time from mid-January through late April, but the alpha has slowed over the last month. We think it could a temporary pause.
The re-opening trade, a slump in new building, decent relative value, and low investor allocations make for a bullish case for the balance of the year. We continue to watch REITs from the perspective of the Beneficiaries, Immediate Impact sub-industry groups, and the Slow Burn group. Bulls want to see each group rise together to confirm a bullish trend.
