Richard Russell, an exceptionally well-regarded Dow Theorist, explained that a stock market can do absolutely anything over short periods of time. Yet, over longer periods, the greatest certainty is “regression to the mean.”
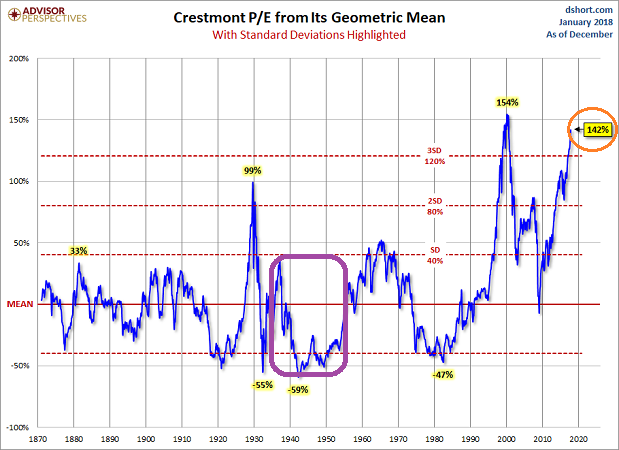
“Regression to the mean” refers to the inevitability of prices revisiting a long-term trend. For example, near the beginning of the Roaring ’20s, stock prices sat nearly 60% below their long-term historical trend. As the Roaring ’20s rolled along, demand for equities outstripped supply to such an extent, the stock market had climbed 80% above its mean.
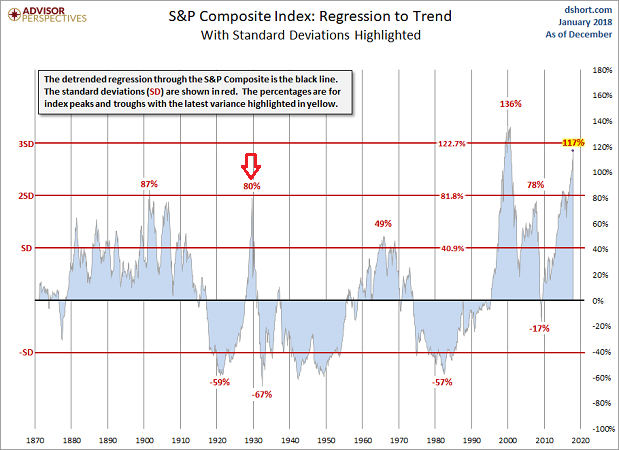
When stock assets crashed in October of 1929, it had not been a foregone conclusion. Yet price regression had been a sure thing. Prices always re-couple.
It is unquestionably true that nobody is capable of predicting when or how stock prices will revisit their mean. On the flip side, “2-sigma events” are rare in and of themselves; that is stocks only hit or approached 2 standard deviation tops in 1901, 1929 and 2007. Monstrous bearish collapses followed.
A 3-sigma event is even more improbable. The peak in 2000 eclipsed three standard deviations. Shortly thereafter, stock prices reverted toward their historical trend, dragging equities lower over a lengthy two-year nine month bear.
At the beginning of the 2018 trading year, the stock market was a whopping 117% above trend. And that was before the powerful surge higher out of the January gate.
Exuberant folks will be quick to point out that regression analysis demonstrates that financial markets are not as irrational as they were in 2000. I suppose that depends upon one’s perspective. There are plenty of indications, such as the “Buffett Indicator,” that we are very close indeed.
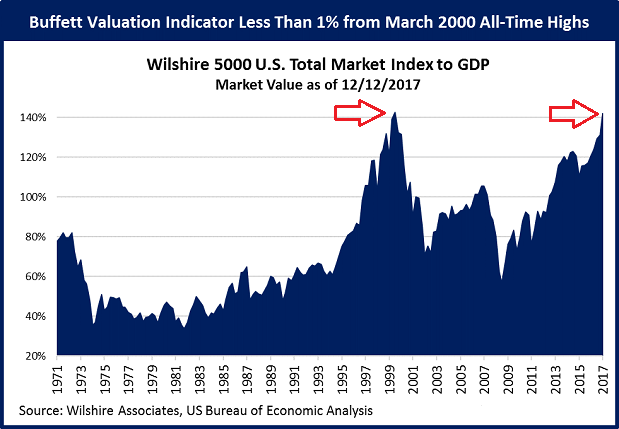
Taking note of the circumstances is not synonymous with the prediction of a market free fall. It is, however, a recognition that prices re-couple.
Consider the fact that the S&P 500 sits roughly 15% above its 5 yearly exponential moving average (EMA). Prominent technical analysts point out that, in most years, the stock market will trade in an annual range where it comes in contact with its 5 EMA. When stocks become unhinged on the upside as they did in 1999 and in 2007, prices did not just reconnect in the following year(s), they eventually traded well below the 5 EMA.
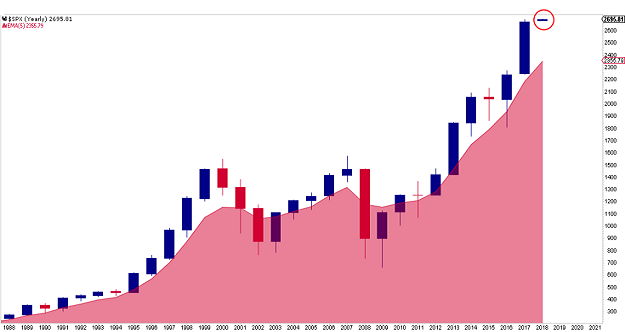
Again, stocks do not have to crater in cataclysmic fashion. They can go down calmly over time. And then they can go back up again. Buy-n-hold advocates certainly can hope for a peaceful price transition.
Keep in mind, while a relationship between a collapse and stock valuations does not exist, the link between valuations and returns over three, five and 10 years remains compelling. Specifically, the higher the initial valuation, the lower the future return. (Note: Today’s “CAPE Ratio” or PE10 is 33.2.)
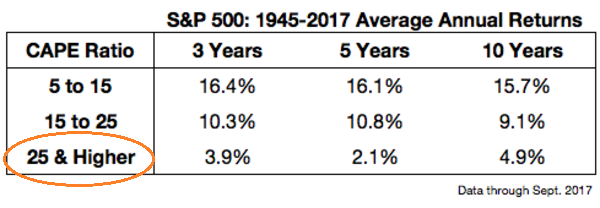
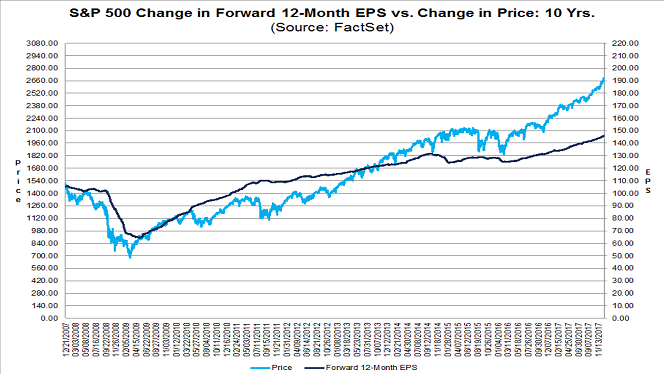
One can poke holes in everything from regression analysis to the Buffett Indicator to the CAPE Ratio. Yet even when one evaluates non-GAAP forward 12-month “guestimates” of where earnings-per-share may wind up, prices appear to have jumped the shark.
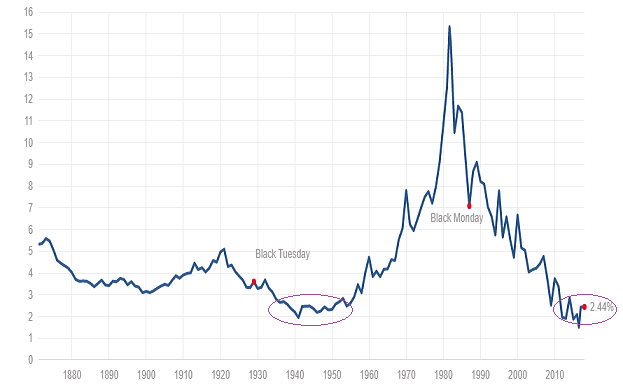
Some will argue that interest rates justify the price action. They appear to have no knowledge that interest rates were at these same levels for 20 years between 1935 and 1954. In that period, four bear markets occurred – two that were particularly brutal 40%-plus bears. Equally worthy of note, valuations were HALF of where they stand right now.
Seriously. If one is married to the notion that low interest rates justify buying anything with the words “blockchain,” “cybersecurity,” and “marijuana,” investigate the 10-year Treasury yield from 1935-1954. Then get a gander at valuations during those two decades versus where they are today. (See below.)
It does not matter if we investigate the long-term technical picture or the long-term fundamental landscape. Nor does it matter if the market is responding favorably to the inexpensive “cost of capital,” central bank policy, global economic growth and/or tax cut legislation. Price regression to the mean will exact a toll.
Those who ignore road signs without a navigation system are likely to get lost. Worse yet, many will see their investment account vehicles get banged up, while others will see their vehicles get totaled.
My clients and I sidestepped the bulk of the 2000-2002 tech wreck and the 2008-2009 financial crisis with a time-tested map. I reduced my exposure to risk assets when the monthly close on the 10-month SMA finished below its trendline.
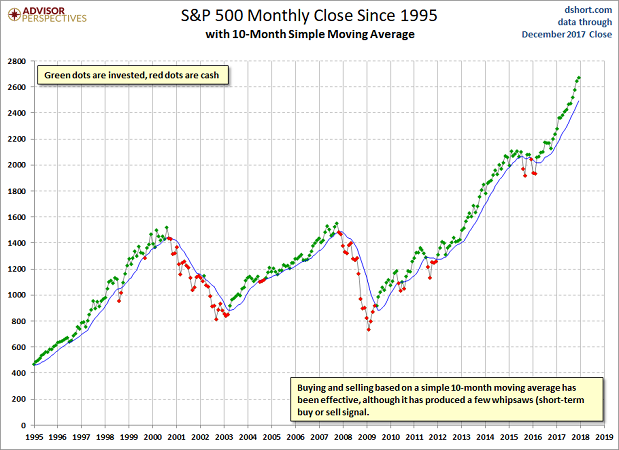
The 10-month SMA is not the only navigation system with tremendous utility. That said, it is a simple and effective tool for managing the risk associated with stock price regression to the mean.
Disclosure Statement: ETF Expert is a web log (“blog”) that makes the world of ETFs easier to understand. Gary Gordon, MS, CFP is the president of Pacific Park Financial, Inc., a Registered Investment Adviser with the SEC. Gary Gordon, Pacific Park Financial, Inc., and/or its clients may hold positions in the ETFs, mutual funds, and/or any investment asset mentioned above. The commentary does not constitute individualized investment advice. The opinions offered herein are not personalized recommendations to buy, sell or hold securities. At times, issuers of exchange-traded products compensate Pacific Park Financial, Inc. or its subsidiaries for advertising at the ETF Expert website. ETF Expert content is created independently of any advertising relationship.
