Last week I was on my annual family vacation, which didn’t afford me the opportunity to publish my normal weekly commentary and portfolio model updates. What is interesting, however, is that relatively little has changed during that time frame.
For continuity, let me begin this week’s update from where I left off:
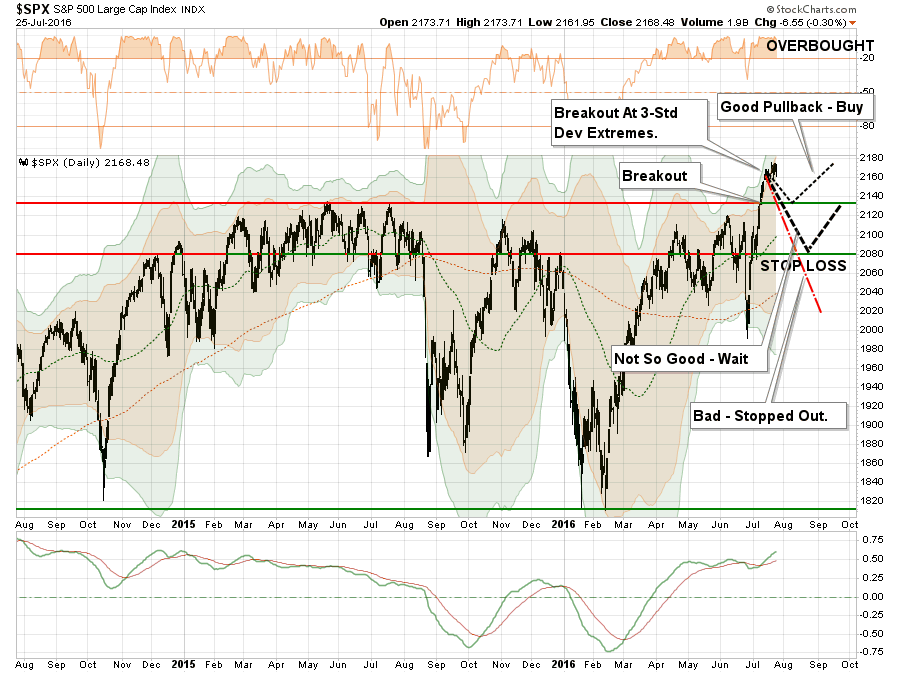
As shown below, the market is currently 3-standard deviations above its 50-day moving average. This is ‘rarefied air’ in terms of price extensions and a pullback is now necessary to provide a better entry point for increasing equity allocations.
Chart updated through Monday’s close
However, as I have noted, there is a difference in pullbacks.
- A pullback to 2135, the previous all-time high, that holds that level will allow for an increase in equity allocations to the new targets.
- A pullback that breaks 2135 will keep equity allocation increases on ‘HOLD’ until support has been tested.
- A pullback that breaks 2080 will trigger “stop losses” in portfolios and confirm the recent breakout was a short-term ‘head fake.'
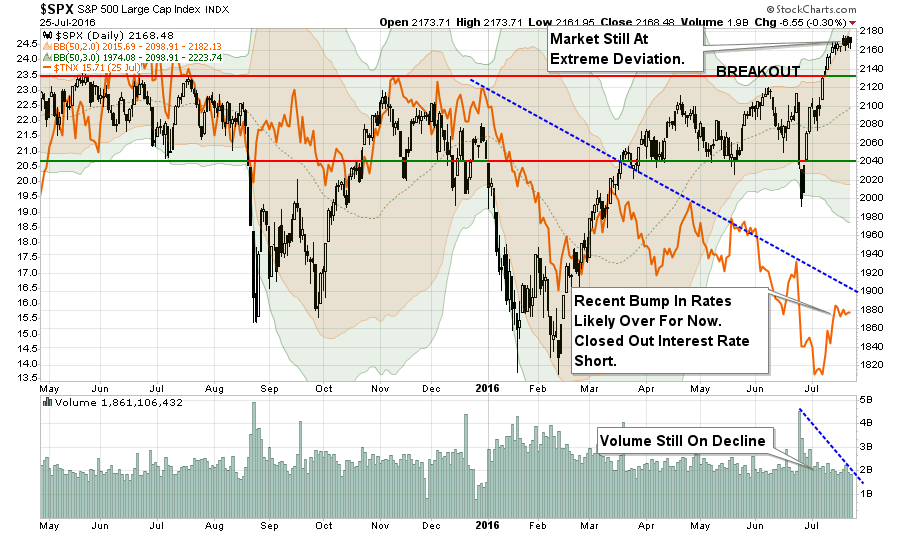
Over the past week, as shown in the chart above, the market has failed to make any significant movement as traders anxiously await the next Fed meeting. With the markets still at a rather extreme deviation from the intermediate-term moving average, the likelihood of a corrective action in the short-term outweighs the probability of a further advance.
Red Flags
But it is not just the deviation that concerns me. Other “red flags” also suggest a corrective action is coming, which aligns with my previous suggestions of a repeat of an August/September correctionary phase.
As Tom McClellan noted recently, the “14-day Choppiness Index”, which tracks the path of a short-term trend, suggests Wall Street’s “uptrend is getting tired.” As McClellan notes, the very linear path for the index implies that the trend is likely to come to an end soon, while more volatile, or choppy, action suggests the opposite. A low reading in McClellan’s index signals a fairly straight line, or linear, move. And presently, his choppiness index is at its lowest level in two decades.
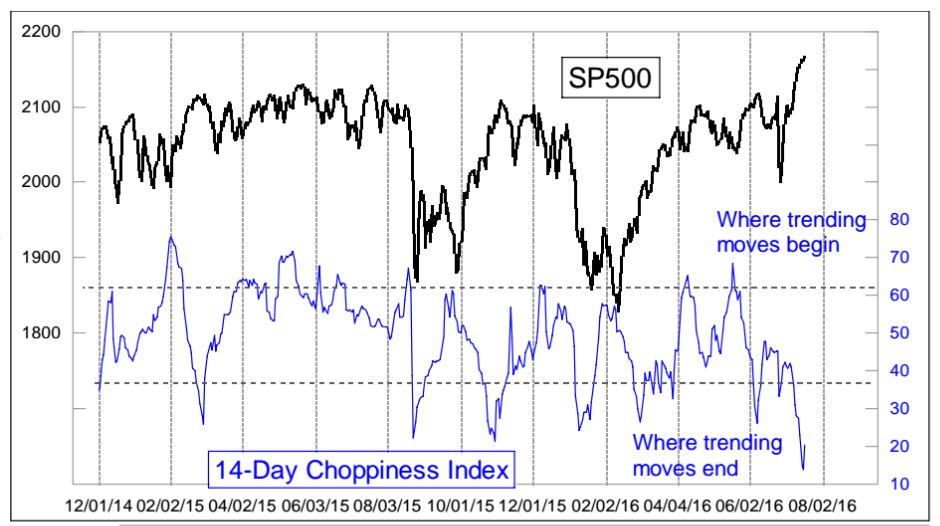
The reading on Monday (7/18/16) was the lowest since Feb. 12, 1996 (yes I scrolled all the way back that far to find a lower one). And in case you are interested, that 1996 instance marked a price top which was not exceeded until 3 months afterward. Linear trends either upward or downward are very exhausting, requiring a lot of energy from either the bulls or the bears to keep everyone in formation and marching together. The market tends toward entropy, so excursions like this toward extreme organization cannot last for very long.
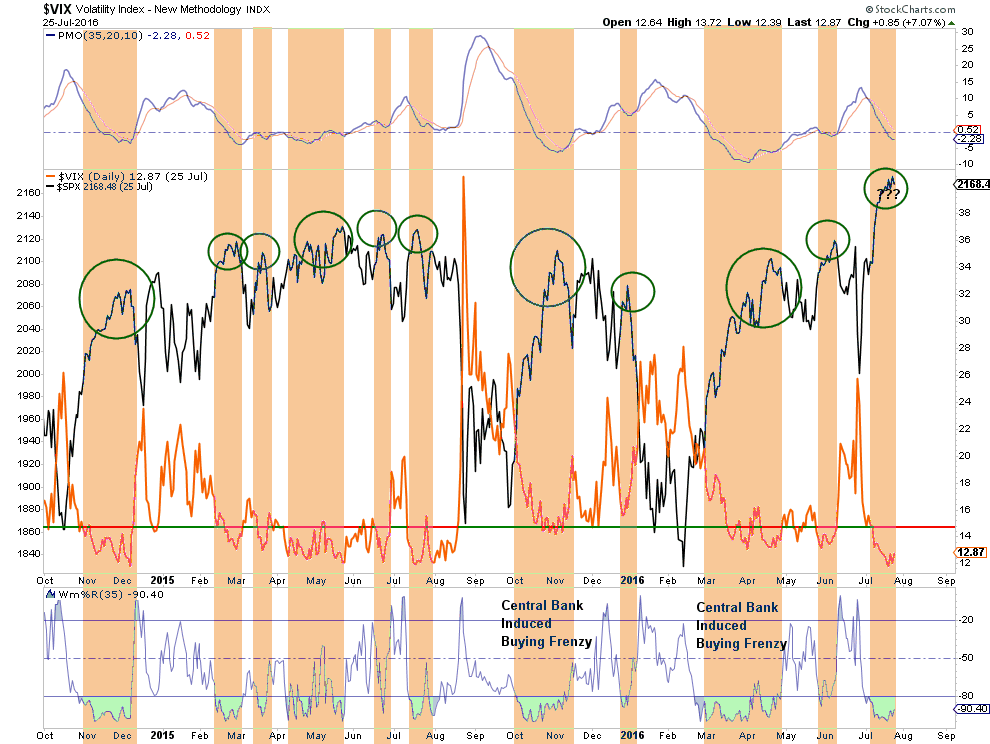
Furthermore, with volatility levels at extremely low levels, the probability of a further advance without a pullback is extremely limited.
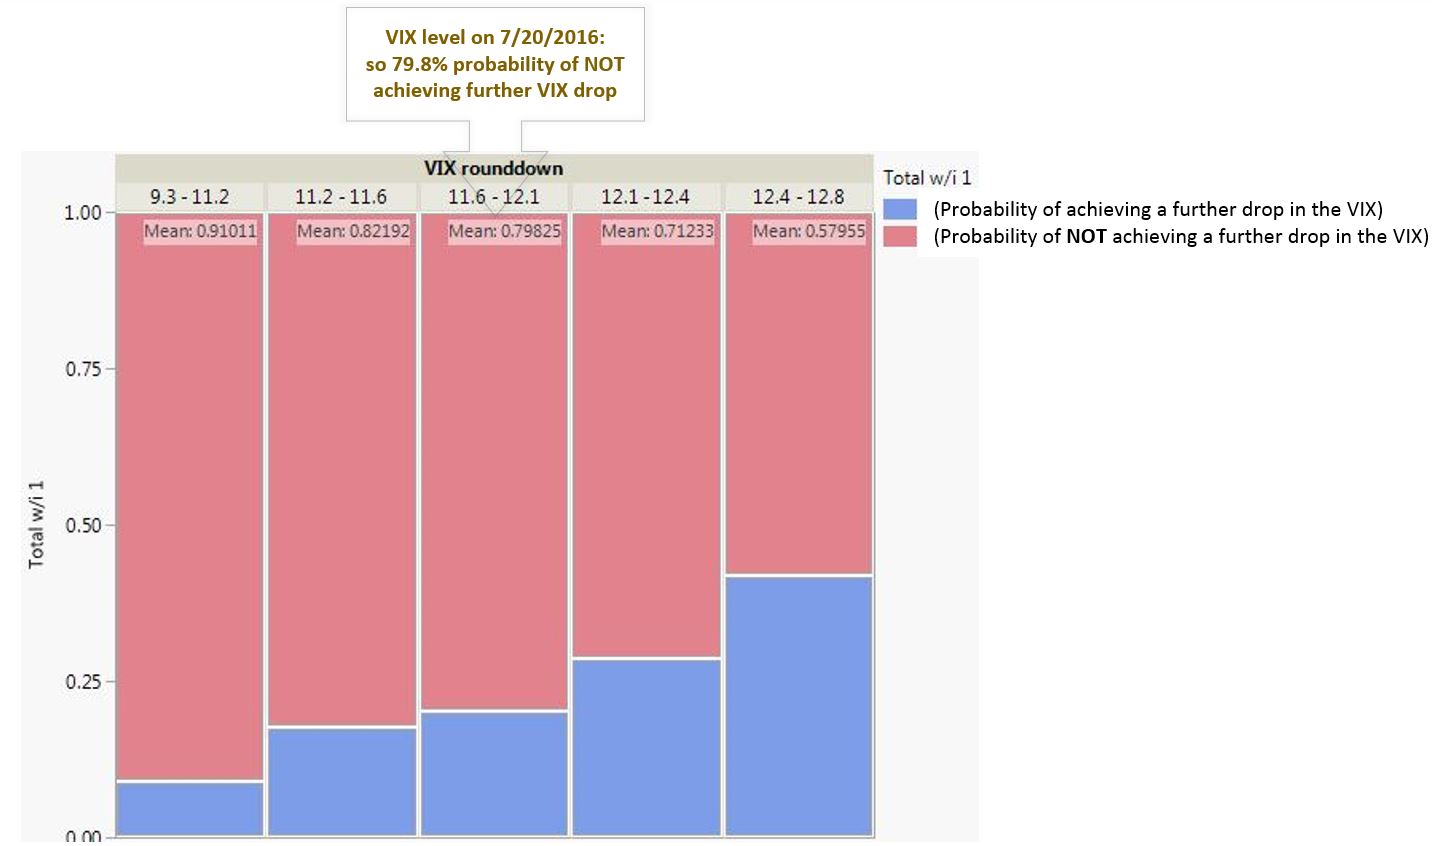
My friend, Salil Mehta made a great comment on this recently noting that at current levels, there is only about a 20% probability of further declines in volatility.
At 11 [in the VIX] you are really close to the floor. chances are higher that you won’t go lower on VIX and will instead pop up on some risk-off day.”
Furthermore, the deviation between global and domestic markets shows the chase for yield continues in both domestic stocks and bonds as the world grinds toward slower economic growth as recently noted by Jesse Felder:
Lastly, the rotation from bonds to stocks -- which confirmed the push higher in the markets beginning in July -- appears to have come to an end. As I previously stated:
Much of the sustainability of the rally going forward is dependent upon the ongoing rotations from ‘safety’ back into ‘risk.’
I closed my interest-rate short (NYSE:TBT) on Monday, which was put on with rates at 1.37%. With the markets overly extended, overly bullish and excessively complacent, the risk of a correction has markedly increased. During a correctionary process, interest rates will fall back toward recent lows as money once again rotates from “risk” back into “safety.”
Understanding The Risks
As I stated in the last week, the safest course of action for those more “bullishly” inclined is to wait for a pullback in prices, increasing exposure to risk assets.
There are clearly substantial reasons to be pessimistic of the markets longer term. Economic growth, excessive monetary interventions, earnings, valuations, etc. all suggest that future returns will be substantially lower than those seen over the last eight years. Bullish exuberance has erased the memories of the last two major bear markets and replaced it with “hope” that somehow “this time will be different.”
Maybe it will be. Probably it won’t be.
That doesn’t change our job as investors, which is to navigate the waters in which we sail currently. This is why I repeatedly focus on investing from a risk-managed basis. Greater returns are generated from the management of “risks” rather than the attempt to create returns by chasing markets. That philosophy was well defined by Robert Rubin, former Secretary of the Treasury, when he said:
As I think back over the years, I have been guided by four principles for decision making. First, the only certainty is that there is no certainty. Second, every decision, as a consequence, is a matter of weighing probabilities. Third, despite uncertainty, we must decide and we must act. And lastly, we need to judge decisions not only on the results, but on how they were made.
Most people are in denial about uncertainty. They assume they’re lucky, and that the unpredictable can be reliably forecast. This keeps business brisk for palm readers, psychics, and stockbrokers, but it’s a terrible way to deal with uncertainty. If there are no absolutes, then all decisions become matters of judging the probability of different outcomes, and the costs and benefits of each. Then, on that basis, you can make a good decision.
It should be obvious that an honest assessment of uncertainty leads to better decisions, but the benefits of Rubin’s approach, and mine, goes beyond that. For starters, although it may seem contradictory, embracing uncertainty reduces risk while denial increases it. Another benefit of acknowledged uncertainty is that it keeps you honest.
A healthy respect for uncertainty and focus on probability drives you never to be satisfied with your conclusions. It keeps you moving forward to seek out more information, to question conventional thinking and to continually refine your judgments and understanding that difference between certainty and likelihood can make all the difference.
We must be able to recognize, and be responsive to, changes in underlying market dynamics if they change for the worse and be aware of the risks that are inherent in portfolio allocation models. The reality is that we can’t control outcomes. The most we can do is influence the probability of certain outcomes, which is why the day-to-day management of risks and investing based on probabilities, rather than possibilities, is important not only to capital preservation but to investment success over time.

