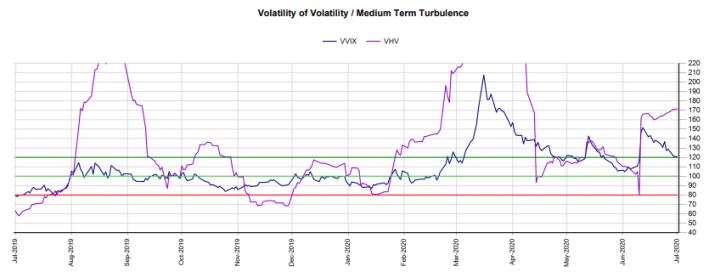
VVIX has declined steadily over the past 2 weeks down to 120 prompting some to infer that this is a bullish development for the stock market. We obviously need a refresher on the VVIX here. VVIX is a VIX-like volatility index on the VIX itself. It measures the implied (or expected) volatility of the VIX over the following 30-day period. It is derived from the prices of VIX options in a fashion similar to how the VIX is derived from the prices of SPX options. One quirk that some traders don’t realize is that VIX options are settled against VIX futures, not the VIX itself. That quirk often tends to result in the VVIX being lower than what some expect because when the VIX futures curve features a heavy contango (has steep slope), VIX futures tend to discount some of the inherently high VIX volatility already. As a result, VVIX tends to trade for long periods of time significantly below related realized VIX volatility measures like VHV, which measures 1 month realized VIX volatility.
Many refer to VVIX as a “volatility of volatility” measure or a 2nd derivative of the SPX. If the VIX is the speed of the SPX, VVIX is the acceleration of the SPX. But that leaves many confused because they don’t understand what that means. Others refer to VVIX as a “turbulence” measure and I find that to be better depiction of the nature of this indicator. It measures the quickness of market moves. If the VVIX is low, declines and rallies in the market are slower and take months to develop. If the VVIX is high, declines and rallies in the market are faster and take only days or weeks to develop. The higher the VVIX, the sharper the EKG diagram of the market. While the VIX measures the amplitude of SPX oscillations, the VVIX measures their period.


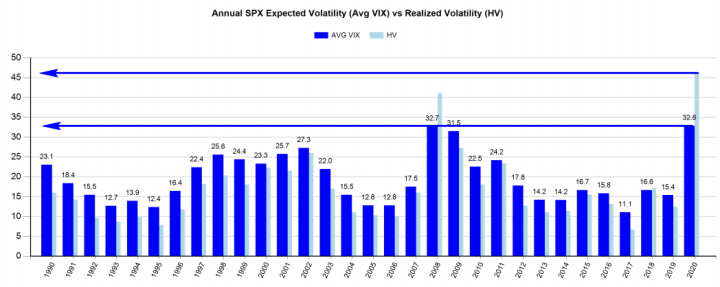
Because of its higher complexity, VVIX is often misunderstood and has acquired a mythical status among traders as an “indicator of truth”. For some, it has replaced the VIX as a leading indicator of stock market volatility because the VIX is perceived to be rigged for one of many reasons – either the FED or US Treasury are perceived to meddle in the SPX options markets to smash the VIX, or new institutional products that systematically sell volatility are perceived to stymie the Volatility Risk Premium (implied volatility premium over realized volatility)s, or the move to passive ETF investing with provides a constant bid to markets and makes them less volatile. All of this reasoning is plausible but the ultimate conclusion that low volatility is a permanent new feature of markets isn’t. Both implied and realized volatility are averaging their highest annual levels ever in 2020, so observations of permanent “low volatility” regime are simply inaccurate.
The VVIX merely reflects how much trust VIX traders have in the current VIX readings just like the VIX reflects how much trust SPX traders have in the current SPX prices. High VVIX means that traders don’t trust the current VIX readings. And if the VIX readings aren’t reliable, that means that SPX prices are perceived as even less reliable. That means that market participants think that SPX prices can change very quickly. That is why today with the SPX at 3000 you have market analysts saying the SPX can go to 1800 by year end on one TV segment and then 3500 on the next. Both are plausible scenarios when VVIX is this high! VVIX simply describes how turbulent the markets are, not necessarily whether they are going up or down. Even if markets stay in place, the trip is likely to be very turbulent.
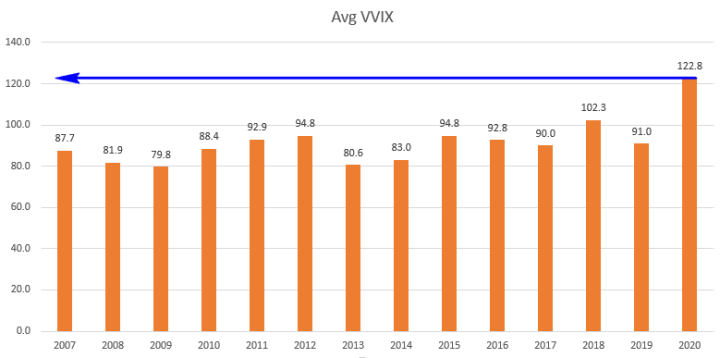
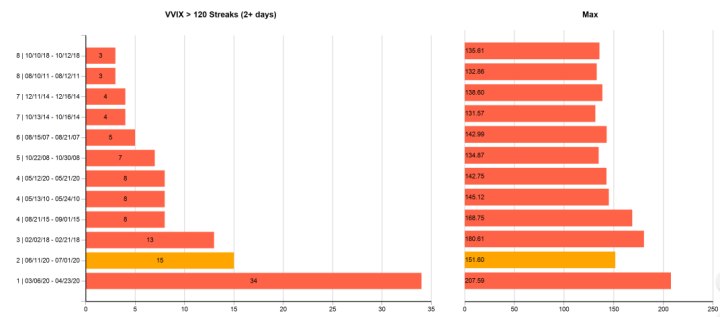
Now to go back to the original statement that 120 VVIX is perceived as a “low” reading by some. Prior to 2020, the VVIX, which was started in 2007, never had readings above 120 for more than 13 consecutive trading days. Most such streaks were 5 days or less. In fact, VVIX traded above 120 only in 79 trading days out of 3270. That is 2.4% incidence rate. Readings above 120 are 97th percentile historically and are so rare, I call them “Cardiac Arrest” levels because they signify extreme market stress. Yet in 2020, we have set new records for how high VVIX can go and how long it can stay above 120. We have already had a 34 trading streak with the VVIX going as high as 207! Before 2020, the highest VVIX reading was 180 in 2018. VVIX is averaging 122.8 in 2020, by far its highest annual average ever. It is 20% higher than the next highest reading of 102.3 in 2018 and 50% higher than 2008 (81.9) which was the most volatile SPX year in post-WW2 history prior to 2020. What we are seeing now with VVIX is simply unprecedented.
2020 is by far the most turbulent market year in history as measured by the VVIX. The recent declines in the VVIX have only pulled it back to its annual average which is by far the highest ever. Traders should not look at the 2 week VVIX change. They should look at the overall VVIX level which remains extremely high. Market turbulence is here to stay. What high VVIX means in practical terms is that being tactical is far more important than being strategic. Traders can’t get married to losing positions because the losses will come faster than usual. If a trade is going against you, you have to get out quick. And if a trade is going for you, surprisingly fast windfalls may come.
By the way, these extremely high VVIX readings in 2020 is why Credit Suisse (SIX:CSGN) decided to shut down TVIX. They are a numeric expression that the probability of a TVIX termination accident are rising and Credit Suisse simply didn’t want to take on that risk anymore with odds this high.


