Investing.com’s stocks of the week
I always like the train of thought that challenges the mainstream. At this point, one can look at the ISM manufacturing data and say it looks terrible, but that is only one data point, and it only represents a fraction of the $18.5 trillion US economy. The ISM reading equals a GDP growth of about 1.5%. Additionally, lost in all of this the IHS Markit PMI that was better than expected at 51.1 and higher than last month’s reading and looks like maybe on the rebound. Then, of course, there is the ISM Services index that is coming out tomorrow morning. So far, estimates are for 55.5, which is slightly lower than last month’s reading of 56.
So we will see what happens tomorrow, to say that the reading will be essential is an understatement.
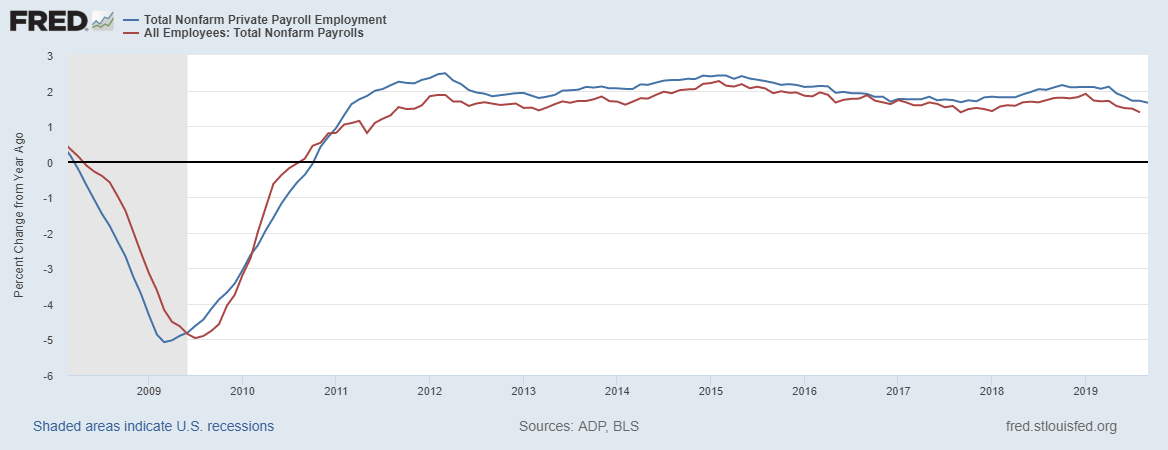
Interestingly, some people are worried about job growth, but that appears to be somewhat consistent, based on historical trends. When looking at the latest data on a y/y basis, we can see that the current rate of job growth is basically in line with historical trends. That rate of growth has slowed over the past year, but it is not abnormally slow.
Plus during previous recession periods, there became a clear U-shaped bottom in the unemployment rate. At this point, we can’t even say that a base has been put into place.
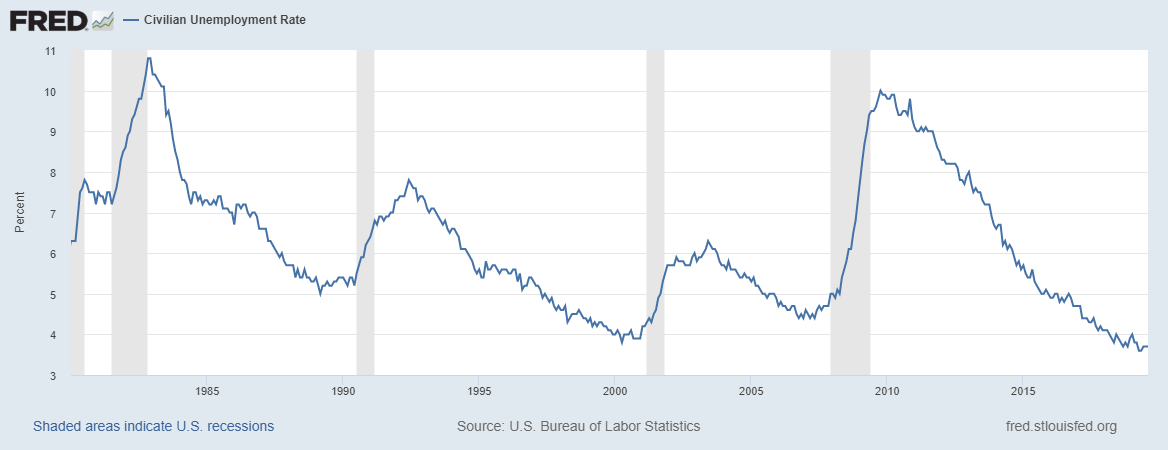
I don’t know; I don’t see it yet. There is nothing here, that tells me a recession is starting anytime soon. We do not even have one data point that corresponds to a reading of less than 1% GDP growth, let alone negative.
Hey look the recession worries only started a year ago, so eventually, those cheering for a recession will get it. What’s a year among friends. Why they cheer for recession is beyond me, but it is just like all the clowns that were pounding their chest when the market was tanking in December saying I told you so. Meanwhile, these were the same guy calling for doom and gloom for the past decade missing out on one of the most exciting bull markets in history.
S&P 500 (SPY)
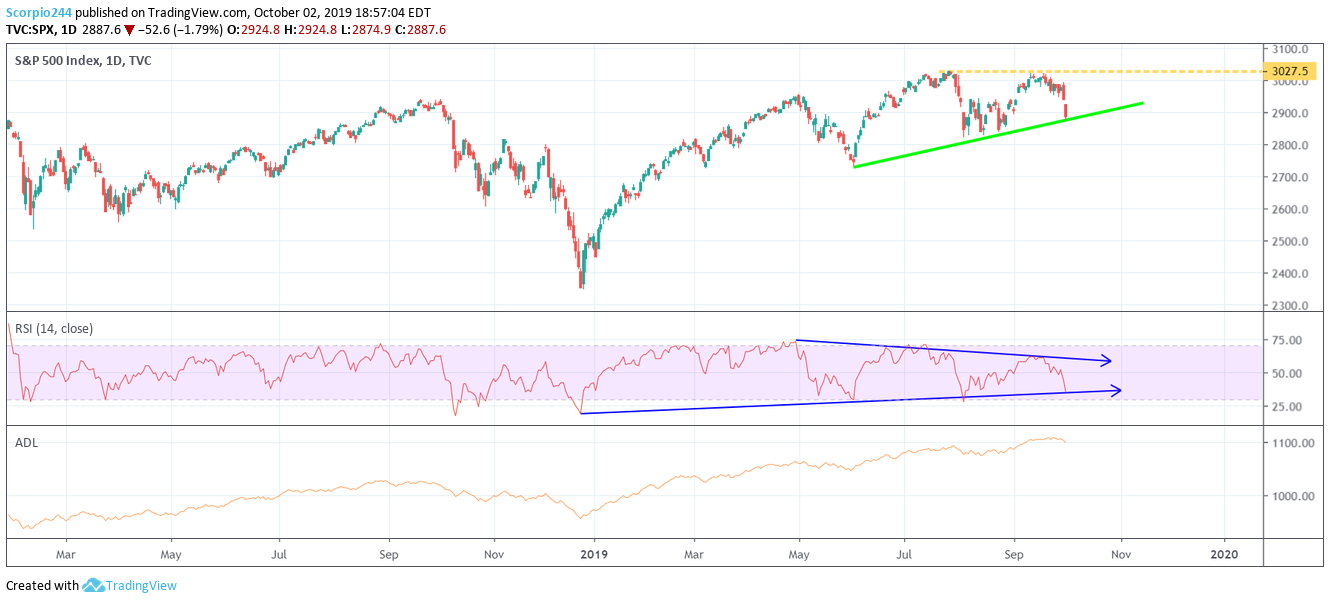
Every once in awhile I like to take a fresh chart and look, to see what stands out. Some times a pattern that you never saw shows itself. The pattern looks somewhat bullish, with a clear uptrend, and resembles a rising triangle. One can see the RSI is in a consolidation mode. If the index is going to spring back to life, this region will.
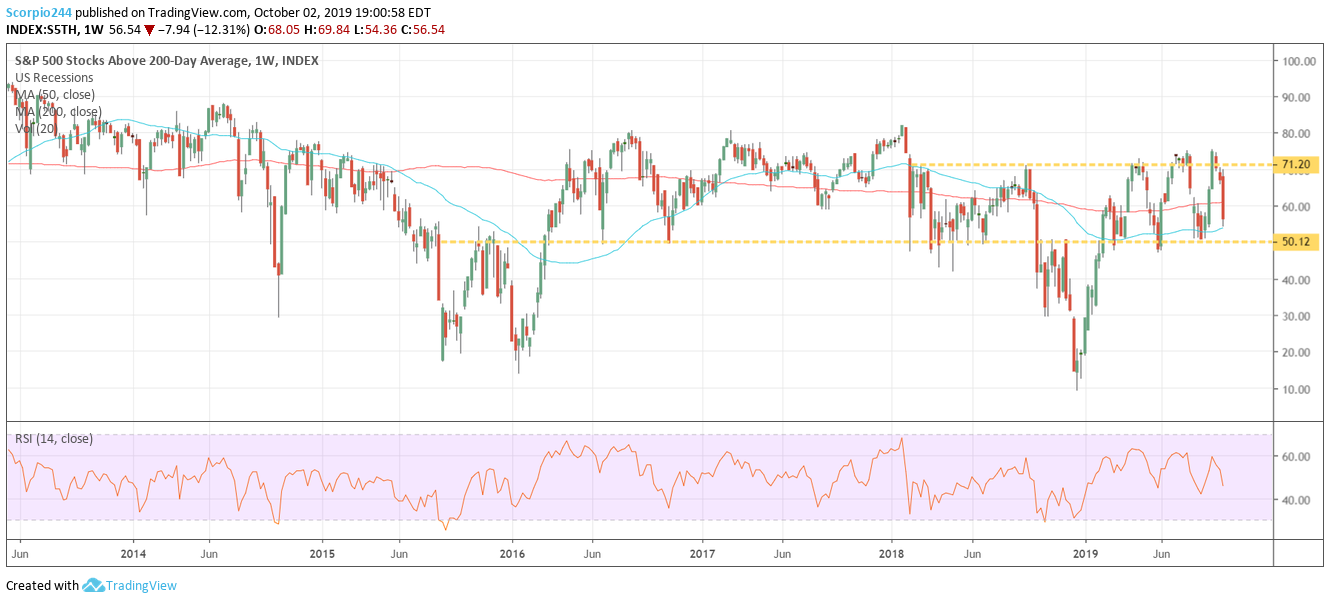
Also, the number of S&P 500 stocks above their 200-day moving average has fallen from around 75 to about 51 in swiftly. As the chart below shows, the reading is back in the lower part of its historical range.
Meanwhile, the number of stocks above their 50-day moving average is near the bottom of the range.
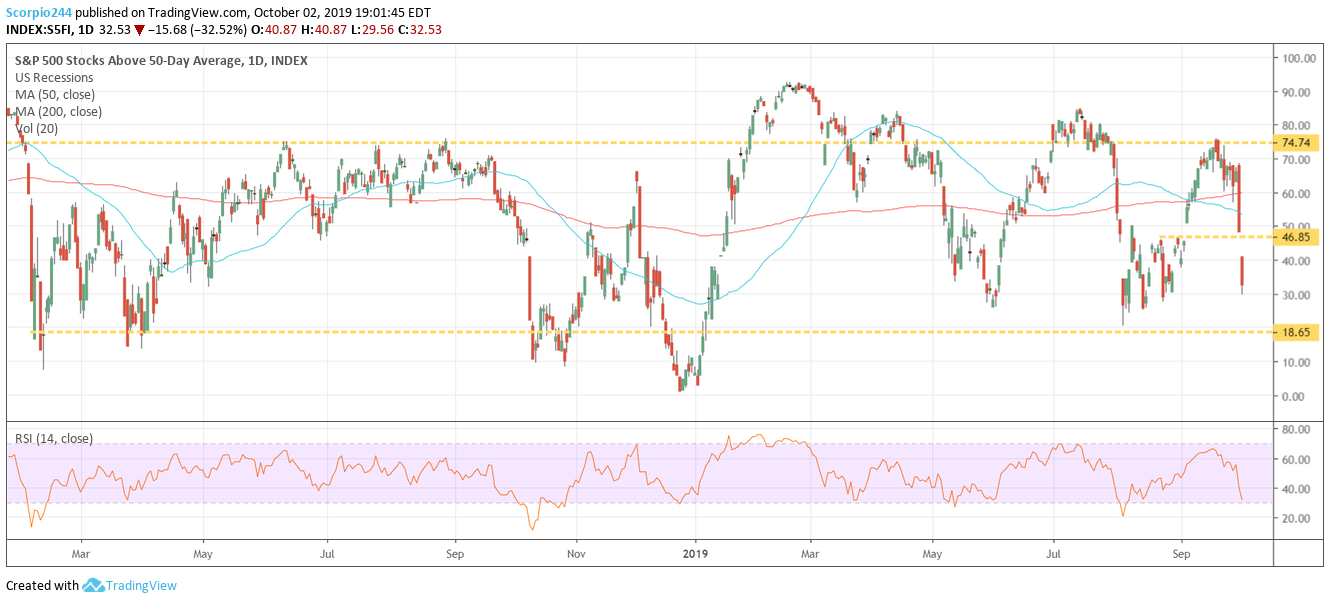
Could the market continue to move lower? Possibly, but I’d say we are pretty close to a bottom.
Tesla (TSLA)
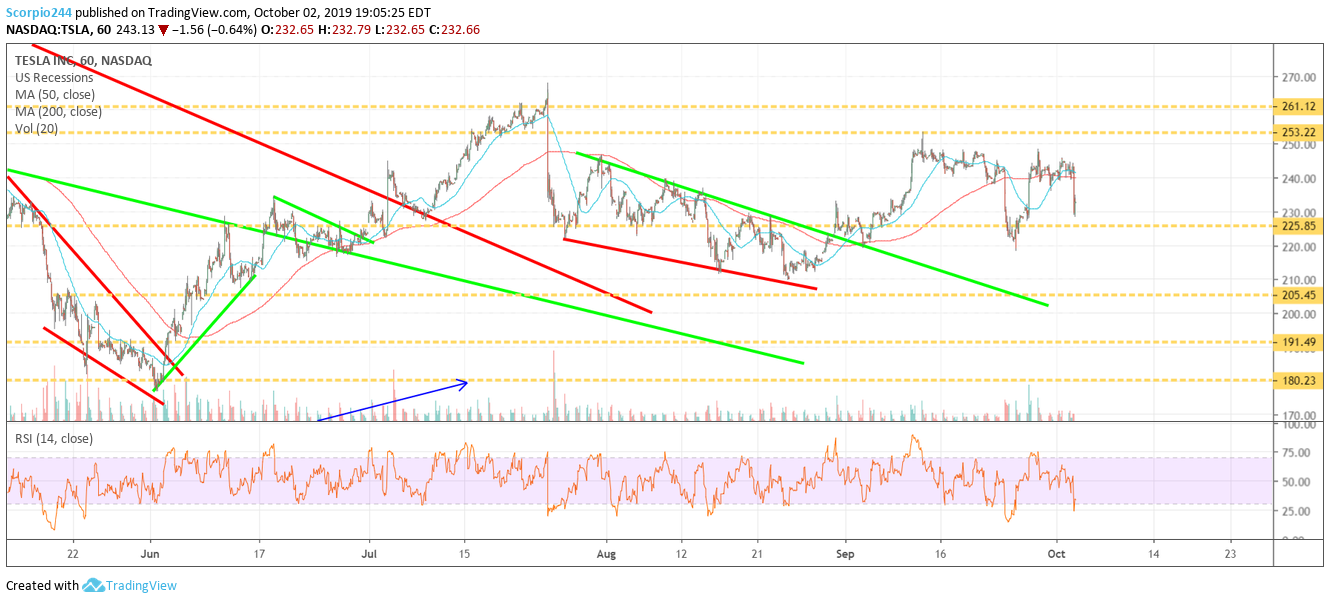
Tesla (NASDAQ:TSLA) is falling after hours on delivery results that were less than estimates? I put a question mark there because I didn’t think estimates were at 99k. For some reason, I had thought there was a demand problem, and nobody wanted these cars, wasn’t that narrative in May and June? Meanwhile, they turn around and deliver 97,000 cars in a quarter. Whatever $225 is support.
Netflix (NFLX)
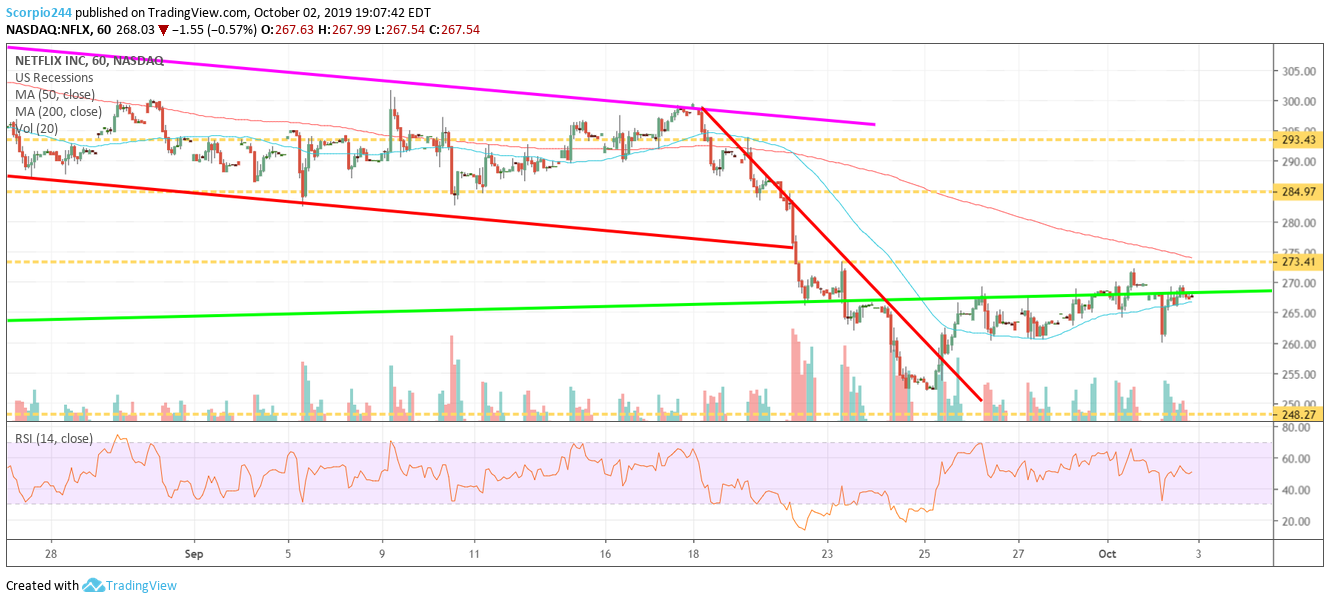
I always find it interesting when a stock like Netflix (NASDAQ:NFLX) that was crushed the last few in September has been so strong. The stock has been solid in the last few days, and one has to think that this stock moves higher from here.
Roku (ROKU)
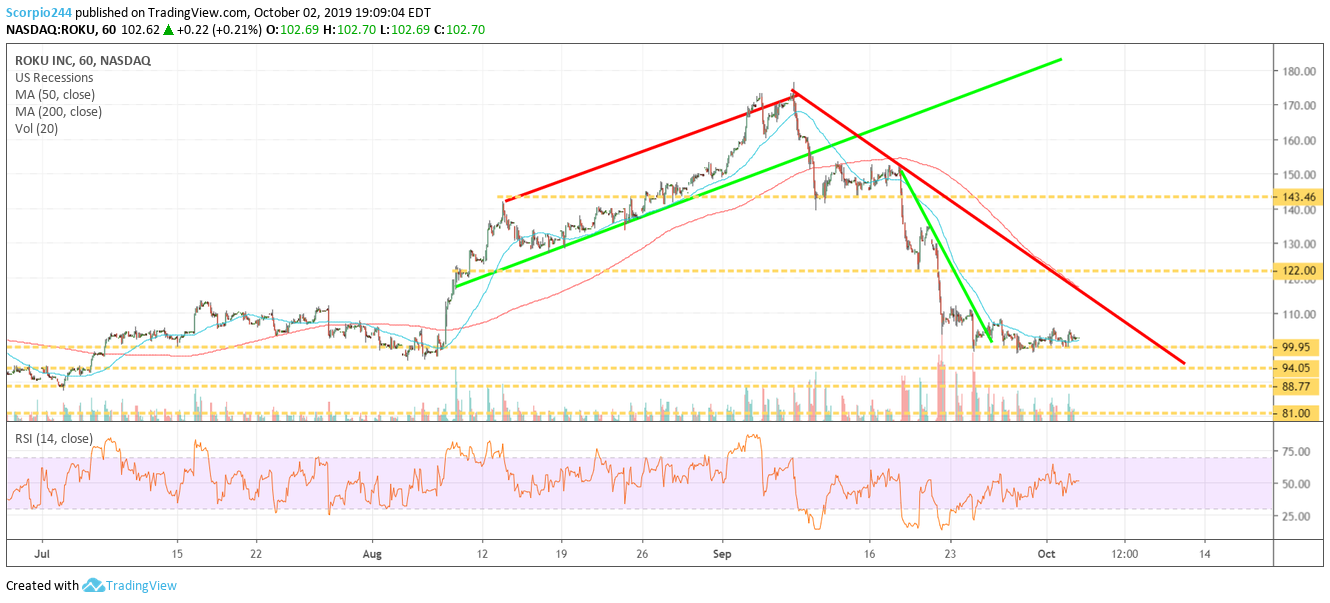
Roku (NASDAQ:ROKU) has held up well too, and maybe I should reconsider my bearish viewpoint on the stock.
Nvidia (NVDA)
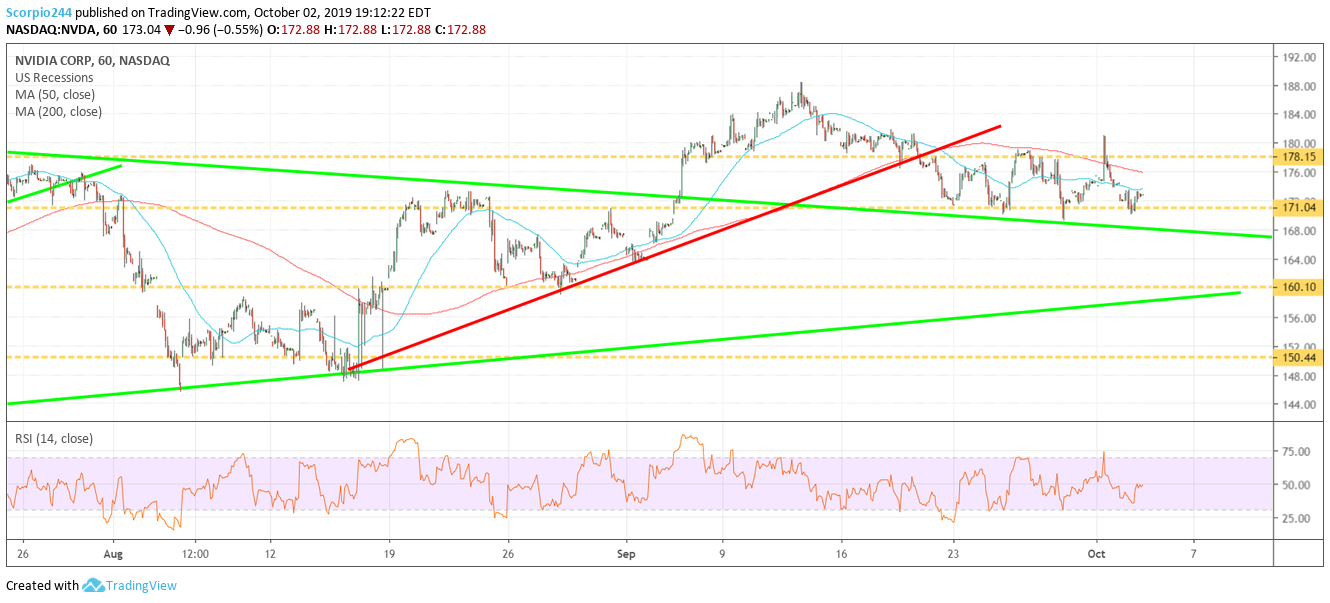
NVIDIA (NASDAQ:NVDA) is another stock that has been holding support at $171. Surprising given the weakness for the semiconductor space. Maybe we can even rebound to $178.
Amazon (AMZN)
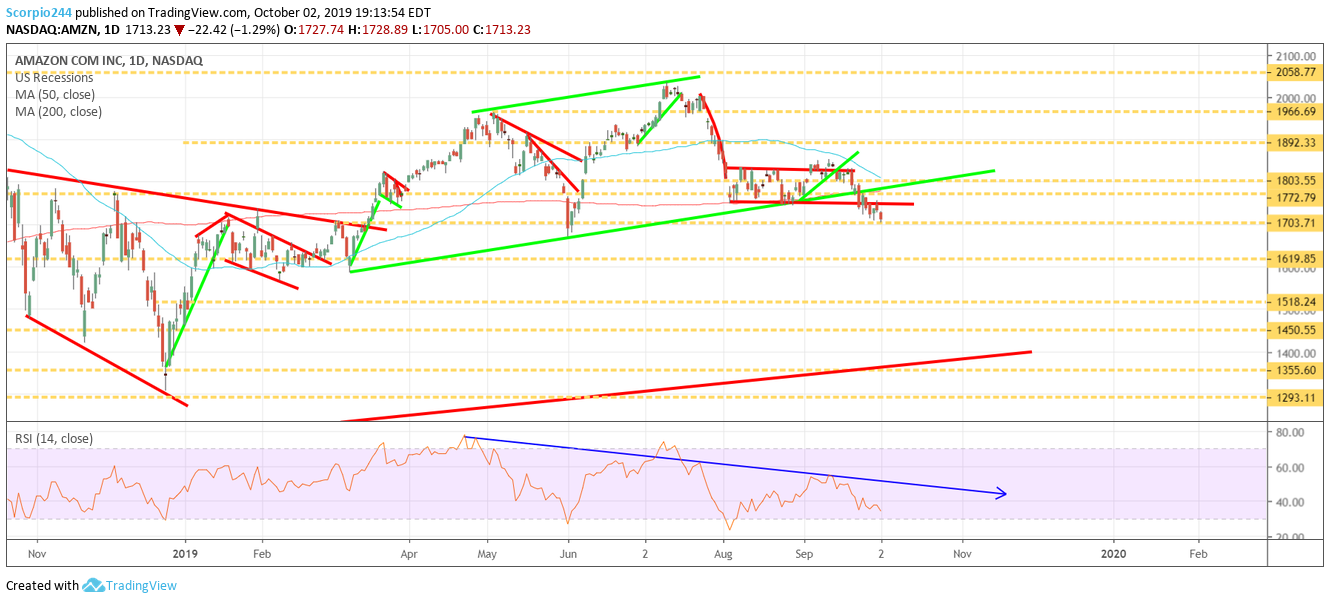
Amazon (NASDAQ:AMZN) is another story. The stock looks weak, and the trend seems lower. $1620 seems like the next stop.
