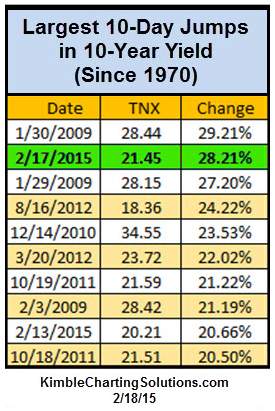
The table below shows that the recent move in U.S. 10-Year yields (interest rates) is one of the largest in the last 45 years. The data is another example of excellent work from fellow contributor Chris Kimble of Kimble Charting Solutions.

For those of us who own stocks or bonds, a logical question is:
How did stocks and bonds perform after the other historical spikes in interest rates?
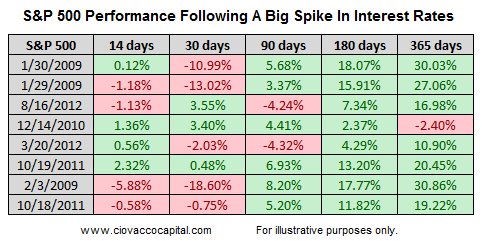
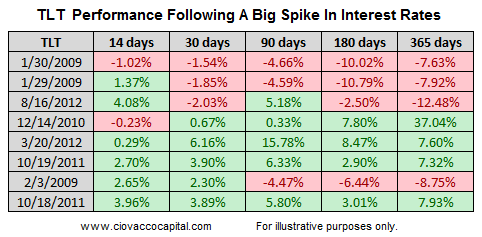
To find the answer, we looked at the performance of the S&P 500 and long-term Treasuries (ARCA:TLT) after the dates shown in the Kimble table above. Two of the most recent dates were removed from our study (2/17/15 and 2/13/15). We choose TLT over (ARCA:IEF) since TLT is much more actively traded. Based on the eight periods studied, the average gain in the S&P 500 one year after a big spike in interest rates was 19.14%. The short-term performance of stocks was typically more subdued.

Long-term treasuries outperformed stocks on average in the first 30 days following significant jumps in 10-year yields.

Averages and medians are helpful, but it is also prudent to review all of the historical examples to better understand the range of reasonable outcomes. If these limited cases from history prove to be value-add, stocks could experience some weakness over the next month or so.

On the bond front, the next 30 days could prove to be better than the last 30 days.

Our approach, as always, will be to remain open to all market outcomes. However, this analysis aligns with other evidence that says stocks could surprise on the upside over the next 12 months.
