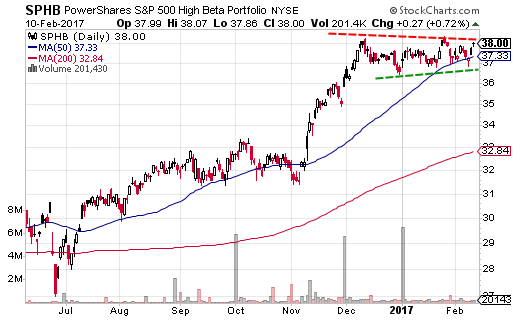
Since the election in the U.S. it has been a 'risk on' environment for stock investors. Last week though, the Powershares Low Volatility ETF (NYSE:SPLV) broke out of a sideways trading range to the upside. At the same time, the Powershares High Beta ETF (NYSE:SPHB) remains trapped in a sideways range.
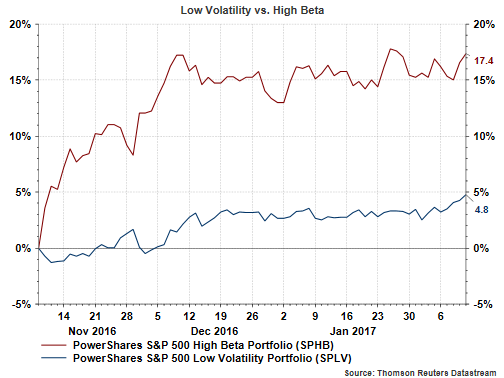
Might the move higher in the low volatility ETF be a signal there is underlying action by some investors to be more defensive in anticipation of a potential pullback on the horizon? The third chart below compares the high beta ETF performance versus the low volatility ETF performance since the election and high beta has far outperformed low volatility. 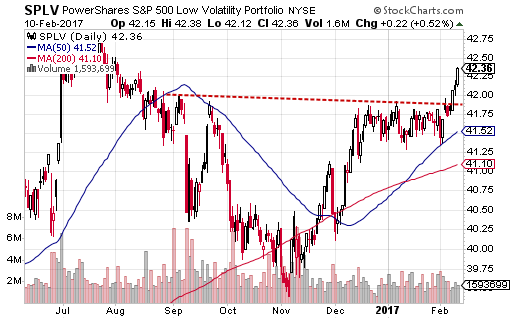
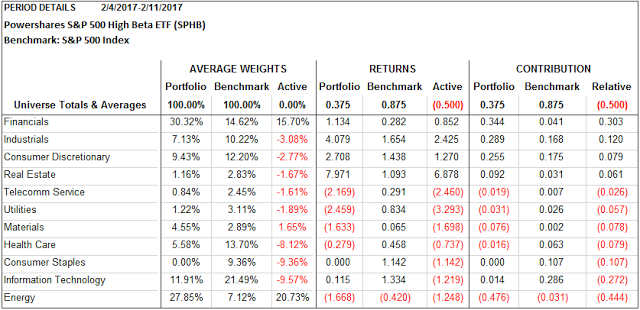
To better understand what is and is not working in both of these ETFs, following is a summary of the sector attribution for both investments.
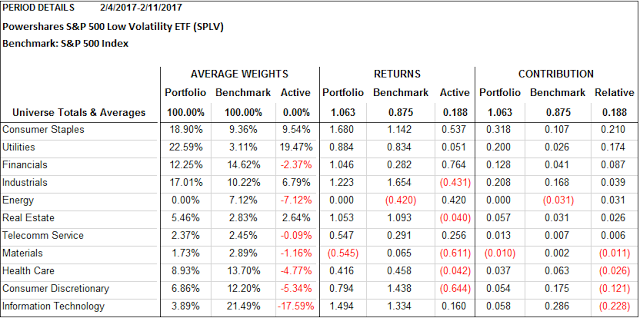
The first table above shows some of the attribution for the low volatility ETF (SHLV) compared to the S&P 500 Index. Notable for SHLV:
- The consumer staples weighting is nine percentage points higher than in the S&P 500 Index. This added 21 basis points to the overall outperformance.
- the utility sector is 19 percentage overweight versus the S&P 500 Index and this added 17 basis points to the outperformance
- SHLV contains no energy stocks and this added a small 3 basis points
In regards to the high beta ETF (SPHB), notable differences versu the S&P 500 Index are:
- the financial sector is 15 percentage poitns overweight compared to the S&P 500 Index and this added 30 basis points to its outperformance
- SPHB is 20 basis overweight to the S&P index and this resulted in a negative 44 basis point versu the S&P and noting SHLV contains no energy positions.
- SPHB is comprised of no consumer staples positions and this cost the index 10 basis points versus the S&P 500 Index and a full 1.68% versus the low volatility index, SHLV.
The equity markets, and specifically the S&P 500 Index, seem to know only one direction and that has been up. Since the election the U.S. the S&P 500 Index is up 8.8% through the close on Friday and the index is up 27.8% on a one year basis. As Charles Kirk of The Kirk Report has been saying about this market,
"At this point, the continued strength is starting to overcome the historical pattern for a post-inaugural pullback in the first month...The Bottom Line: It remains a bull market until proven otherwise [emphasis added]...and prices are still not showing any new signs of vulnerability as the test of upper trendline resistance begins."
I have written recently that individual investor sentiment reported by AAII is trending more cautious and the below chart also points to a similar conclusion.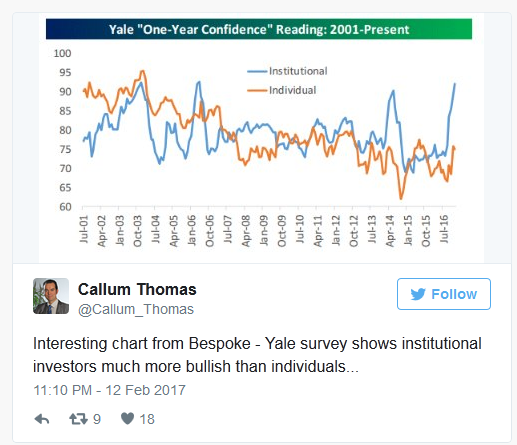
One week certainly does not constitute a trend. However, the strength of the S&P 500 Index advance over the last eight years and the recent extreme low volatility of the broader market warrants one to expect a pullback in stocks. The S&P 500 Index has not seen a move of greater than +/-1% since December 7, 2016. 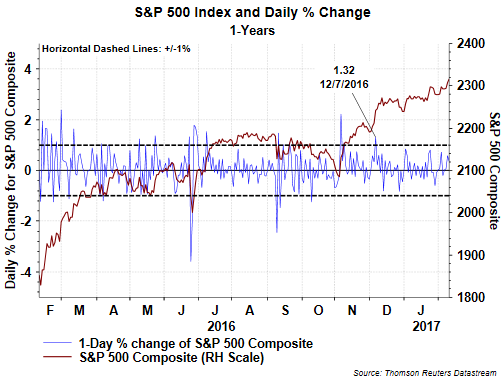
It is apparent the defensive sector weighting of SHLV has benefited its return against both the high beta ETF and the S&P 500 Index, i.e., over weight in staples and utilities. Longer term though, the balance of the year, we continue to believe stocks will reward investors.
