👀 Watchlist Winners: Copy Legendary Investors' Portfolios in One ClickCOPY FOR FREE

Recent Data And Yield-Curve Fears

Published 07/03/2018, 12:00 PM
Updated 07/09/2023, 06:31 AM
US500
-
US2YT=X
-
US10YT=X
-

According to numerous articles written in the last six months, a flattening yield curve nearing the zero boundary is a major red flag for stocks and the economy.

10-year Yield Vs. 2-Year Treasury Yields
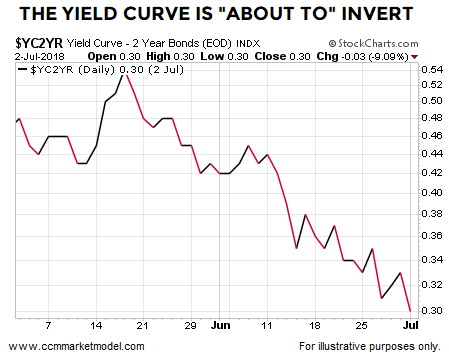
The Yield Curve: 10-Yr. Yield Less 2-Yr. Yield

Data This Week Looks Strong

Monday's ISM Manufacturing data landed in a "strong and growing economy" range and nowhere near an "imminent recession" range. From MarketWatch:

The Institute for Supply Management said its manufacturing index rose to 60.2% last month from 58.7% in May. That matches the second highest level of the current economic expansion that began in mid-2009. In February the index hit a 14-year high. Readings over 50% indicate more companies are expanding instead of shrinking.

During the holiday-abbreviated session Tuesday, the latest read on factory orders was released. From MarketWatch:

U.S. factory orders rose 0.4% in May, led by an increase in demand for machinery and military wares. Economists polled by MarketWatch has forecast no change. The originally reported 0.8% decline in factory orders in April, meanwhile, was revised down to show a 0.4% drop, the government said Tuesday.

The Misunderstood Yield Curve

This week's video takes a detailed and factual look at the yield curve, helping us address the following questions:

  • Is it possible for really good things to happen after a period that features a flattening yield curve?
  • If the yield curve continues to fall, should we sprint for the nearest exit?
  • Is there any historical difference between "the yield curve is about to invert" and "the yield curve has already inverted"?
  • In the 2000 and 2007 cases, how long did it take for the major stock market peak to arrive after the first sign of yield curve inversion?
  • In the 2000 and 2007 cases, how much did the S&P 500 gain between the first sign of yield curve inversion and the major market peak?

Latest comments

Loading next article…
Risk Disclosure: Trading in financial instruments and/or cryptocurrencies involves high risks including the risk of losing some, or all, of your investment amount, and may not be suitable for all investors. Prices of cryptocurrencies are extremely volatile and may be affected by external factors such as financial, regulatory or political events. Trading on margin increases the financial risks.
Before deciding to trade in financial instrument or cryptocurrencies you should be fully informed of the risks and costs associated with trading the financial markets, carefully consider your investment objectives, level of experience, and risk appetite, and seek professional advice where needed.
Fusion Media would like to remind you that the data contained in this website is not necessarily real-time nor accurate. The data and prices on the website are not necessarily provided by any market or exchange, but may be provided by market makers, and so prices may not be accurate and may differ from the actual price at any given market, meaning prices are indicative and not appropriate for trading purposes. Fusion Media and any provider of the data contained in this website will not accept liability for any loss or damage as a result of your trading, or your reliance on the information contained within this website.
It is prohibited to use, store, reproduce, display, modify, transmit or distribute the data contained in this website without the explicit prior written permission of Fusion Media and/or the data provider. All intellectual property rights are reserved by the providers and/or the exchange providing the data contained in this website.
Fusion Media may be compensated by the advertisers that appear on the website, based on your interaction with the advertisements or advertisers.
© 2007-2024 - Fusion Media Limited. All Rights Reserved.