• RBA releases monetary policy minutes At this meeting, the Bank kept its benchmark interest rate unchanged amid signs of improvement of business conditions and a somewhat stronger growth in employment. In the minutes of the meeting, the Bank reiterated that the exchange rate was adjusting to significant declines in commodity prices and boosting demand for domestic production, which had translated to stronger employment growth. Their upbeat view was confirmed some days following the meeting by the Australian employment report, which showed the biggest increase in net employment during November in over 15 years and a decrease in the unemployment rate. Even though the Bank maintained the likelihood for further easing, the overall tone was neutral and the upbeat view over the economy supported AUD briefly.
• Today’s highlights: The Swedish central bank holds its monetary policy meeting and expectations are for the Bank to remain on hold. At its last policy meeting, the Riksbank kept its policy unchanged as was broadly expected, but expanded its bond purchases program. This was the fourth time since February that the Bank expanded its QE program, and maintained the likelihood for further interest rate cuts. In the statement accompanying the decision, the Bank said that economic activity in Sweden is strengthening and inflation is showing a clear upward trend. On top of that, the disappointment by the ECB on the 3rd of December meant that the expected SEK appreciation against the EUR did not materialize, which leaves room for the Riksbank to wait a bit more before acting again. Therefore, the Bank is expected to keep its powder dry, and leave its policy unchanged. As a result, the focus will shift on the statement accompanying the decision for any signs that Sweden’s economy is gaining momentum. This could support SEK a bit, at least temporarily.
• In the UK, the CPI data for November are forecast to show that the inflation rate has escaped from the negative territory and has risen to 0.1% yoy. Also, the core CPI is expected to have accelerated to 1.2% yoy from 1.1% yoy before. This is in line with the BoE’s view seen in the minutes of its latest monetary policy meeting, where officials noted that although the CPI rate was negative in October, they expect it to have been slightly positive in November. This could support the pound.
• From Germany, the ZEW survey for December is coming out. The current situation index is expected to see a modest decline, while the expectations index is expected to rise. This could offset the decline in the current situation index and support the common currency a bit.
• From the US, both the headline and core CPI rates are expected to have accelerated in November. This is the last piece of data ahead of the Fed’s decision and they are likely to enter the basket of the indicators supporting a rate hike. With just a day ahead of the crucial FOMC meeting, improvement in the CPI rate could support the greenback. The Empire State manufacturing index is expected to show that business conditions for New York’s manufacturers continued to deteriorate in December. Also, the NAHB housing market index for the same month is expected to increase slightly.
• In Canada, manufacturing sales are expected to have fallen in October but at a slower pace than previously. Even though this is usually not a major market mover, it could weaken the loonie further. The Bank of Canada also releases the Financial System review, which deals with the main risks to financial stability.
• We have one speaker on Tuesday’s agenda: Bank of Canada Governor Stephen Poloz speaks.
The Market
EUR/USD break briefly our 1.1030 resistance line

• EUR/USD broke briefly above the 1.1030 (R1) resistance zone on Monday but fell back again to trade below that area towards the end of the US trading session. A clear break of that resistance line could trigger larger bullish extensions and perhaps aim initially our next resistance at 1.1070 (R2). I still see negative divergence between our short-term oscillators and the price action, which could point to a pause in the advance, at least temporarily. Even though the price made a higher high on the 4-hour chart, the RSI and the MACD failed to move above their prior levels. The RSI lies just below its black downtrend line, while the MACD has topped and fallen below its trigger line. Switching to the daily chart, I see that the pair remains above the 1.0800 barrier, the lower bound of the range it had been trading from the last days of April until the 6th of November. As a result, although I believe the short-term picture remains somewhat positive, I prefer to take a neutral stance as far as the overall outlook of EUR/USD is concerned.
• Support: 1.0920 (S1), 1.0875 (S2), 1.0815 (S3)
• Resistance: 1.1030 (R1), 1.1070 (R2), 1.1120 (R3)
GBP/USD found support near the black downtrend line

• GBP/USD traded lower on Monday breaking below the support-turned-into-resistance line of 1.5185 (R1). The pair found support at the crossroad of our next support level of 1.5120 (S1) and the black downtrend line taken from the peak of the 2nd of November. Given that today we get the UK CPI data for November and the expectations are for a turnaround from the previous month, I see risks to the upside for the pair. However, we also get the US CPI data later in the day, which are expected to improve as well. Therefore, we could see the reverse of any gains following the release of the UK CPI when the US data are due out. Always keeping in mind that we don’t see any unexpected disappointment and the actual figures meet or exceed current market consensus. As for the broader trend, the price structure remains lower peaks and lower troughs.
• Support: 1.5120 (S1), 1.5050 (S2), 1.5000 (S3)
• Resistance: 1.5185 (R1), 1.5240 (R2), 1.5300 (R3)
USD/JPY bias to the downside

• USD/JPY remained locked in a consolidation mode on Monday, within the resistance zone of 121.30 (R1) and the 120.60 (S1) support area. Even though a break in either direction is likely to determine the forthcoming near-term bias, given that the pair has fallen below the sideways range it has been trading since the 6th of November, I believe the rate is poised to move lower. Looking at our short-term momentum signs, the RSI found resistance below the 50-level and turned lower, while the MACD, already in its negative territory moves along its trigger line. As for the broader trend, the break below the 122.20 (R2), the lower boundary of the sideways range mentioned before, has shifted the bias to the downside, in my view.
• Support: 120.60 (S1), 120.00 (S2), 119.65 (S3)
• Resistance: 121.30 (R1), 122.20 (R2), 122.80 (R3)
Gold continues its retreat

• Gold tumbled on Monday after hitting resistance at the upper boundary of the downside channel it has been trading since the 4th of December. The decline was halted at the lower boundary of the channel. A break below the latter barrier, which the precious metal failed to overcome on the 7th, 11th and 14th of December, is needed for the precious metal to extend its downside wave and perhaps aim our 1055 (S1) support line. So we have to wait and see whether the bears are strong enough to start a new attempt to push gold lower. On the daily chart, I see that the plunge below the upside support line taken from the low of the 20th of July has shifted the medium-term outlook to the downside. As a result, I believe that the metal is poised to continue its down road in the foreseeable future and I would treat any possible extensions of it, as a corrective phase for now.
• Support: 1055 (S1), 1046 (S2), 1035 (S3)
• Resistance: 1072 (R1), 1080 (R2), 1088 (R3)
WTI found buy orders just below 35.00

• WTI broke briefly the psychological support level of 35.00 (S1) but found strong buy orders and surged to test our 36.70 (R1) resistance line. The sharp rise on Monday has shifted the near-term outlook to neutral and I would prefer to wait to see a clear break below 35.00 (S1) to trust further declines. I would expect a clear move below that hurdle to initially challenge the 34.00 (S2) line. A break below 34.00 (S2) is likely to pave the way for the key support zone of 33.55 (S3), last seen in February 2009. Taking a look at our oscillators though, I see the RSI exit its below-30 territory and found resistance at the 50-level, while the MACD, although negative, has crossed above its trigger line. These momentum signs support my view to wait for a clear break below 35.00 (S1) to trust another leg lower. On the daily chart, I see that WTI has been printing lower peaks and lower troughs since the 9th of October. What is more, on the 7th of December, the price fell below the lower bound of a downside channel, something that reveals accelerating downside speed and increases the possibilities for further declines and a test of the key zone of 33.55 (S3).
• Support: 35.00 (S1), 34.00 (S2), 33.55 (S3)
• Resistance: 36.70 (R1), 37.50 (R2), 38.55 (R3)
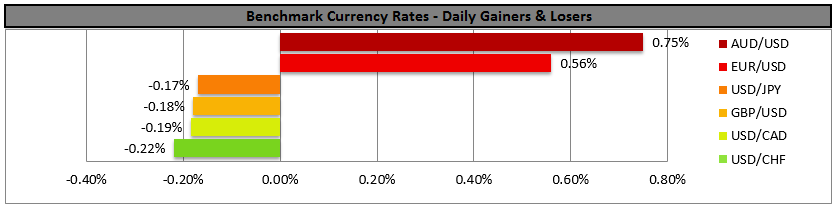
BENCHMARK CURRENCY RATES - DAILY GAINERS AND LOSERS
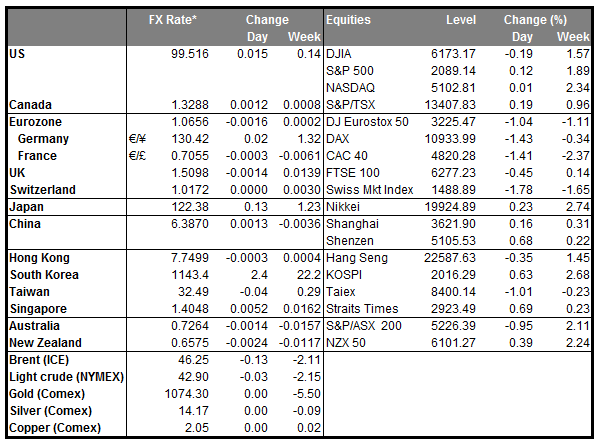
MARKETS SUMMARY