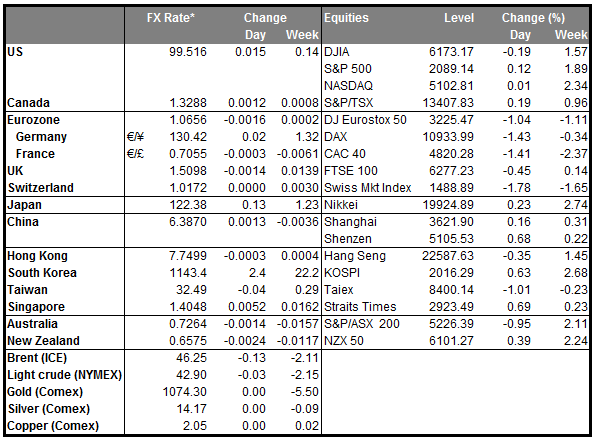
• RBA on hold, but leaves door open The RBA remained on hold overnight as was widely expected, but signalled that continued low inflation may provide scope for further easing, should that be appropriate to support demand. The Bank’s statement acknowledged the global turmoil and the risks that poses to domestic conditions, which could explain the fall in AUD following the decision. However, officials did not revise down their forecasts for the country’s economic outlook, noting improvements in domestic conditions. On Friday, the RBA releases its Statement on Monetary policy which will provide new forecasts on Australia’s economy. So, the Board will now have to assess the effects of global headwinds based on new information. Therefore, we expect the negative sentiment towards the Aussie to continue until Friday. If the updated forecasts show that the Bank now expects domestic growth or inflation to moderate as a result of global developments, the currency could fall further.
• Fed’s Fischer: Difficult to judge the impact of the recent turmoil on US economy Fed’s Vice-Chair Fischer stated that if global developments lead to persistent tightening of financial conditions, they could signal a slowing global economy that may affect growth and inflation in the US. Fischer’s remarks follow a week of soft economic data out of the US, which showed a significant slowdown in Q4 growth and flat consumer spending in December. These data have already raised concerns on whether growth and inflationary pressures have continued being soft in Q1, which affected expectations on the Fed’s pace of normalization. Currently, markets only price in one more rate hike in 2016 compared to the Fed’s expectations of 3-4. Fisher’s comments came to add to these worries, something that could push market expectations further back. As a result, we could see the greenback losing some of the steam it has gained so far in the year.
• Today’s highlights: During the European day, the calendar is relatively light. The indicator that will probably attract most of investors’ attention is the UK construction PMI for January. The index is forecast to have declined to 57.5 from 57.8 in December, but given Monday’s unexpected improvement in the manufacturing PMI, we see the likelihood for a positive surprise in the construction data as well. This could support the pound, at least temporarily. Signs of improvement in the manufacturing and construction sectors could be some early evidence that the UK economy has entered the year on a stronger footing. However, the picture will get clearer on Wednesday, when we get the service-sector PMI as this sector holds the reins of the British growth.
• In the Eurozone, the bloc’s unemployment rate for December and the German unemployment rate for January are coming out. Both the rates are expected to have remained unchanged and as a result, we expect the reaction in the common currency to be minimal at these releases. We get Eurozone’s PPI for December as well.
• As for the speakers, SNB President Thomas Jordan, ECB Executive Board member Benoit Coeure and Kansas City Fed President Esther George speak.
The Market
EUR/USD trades higher
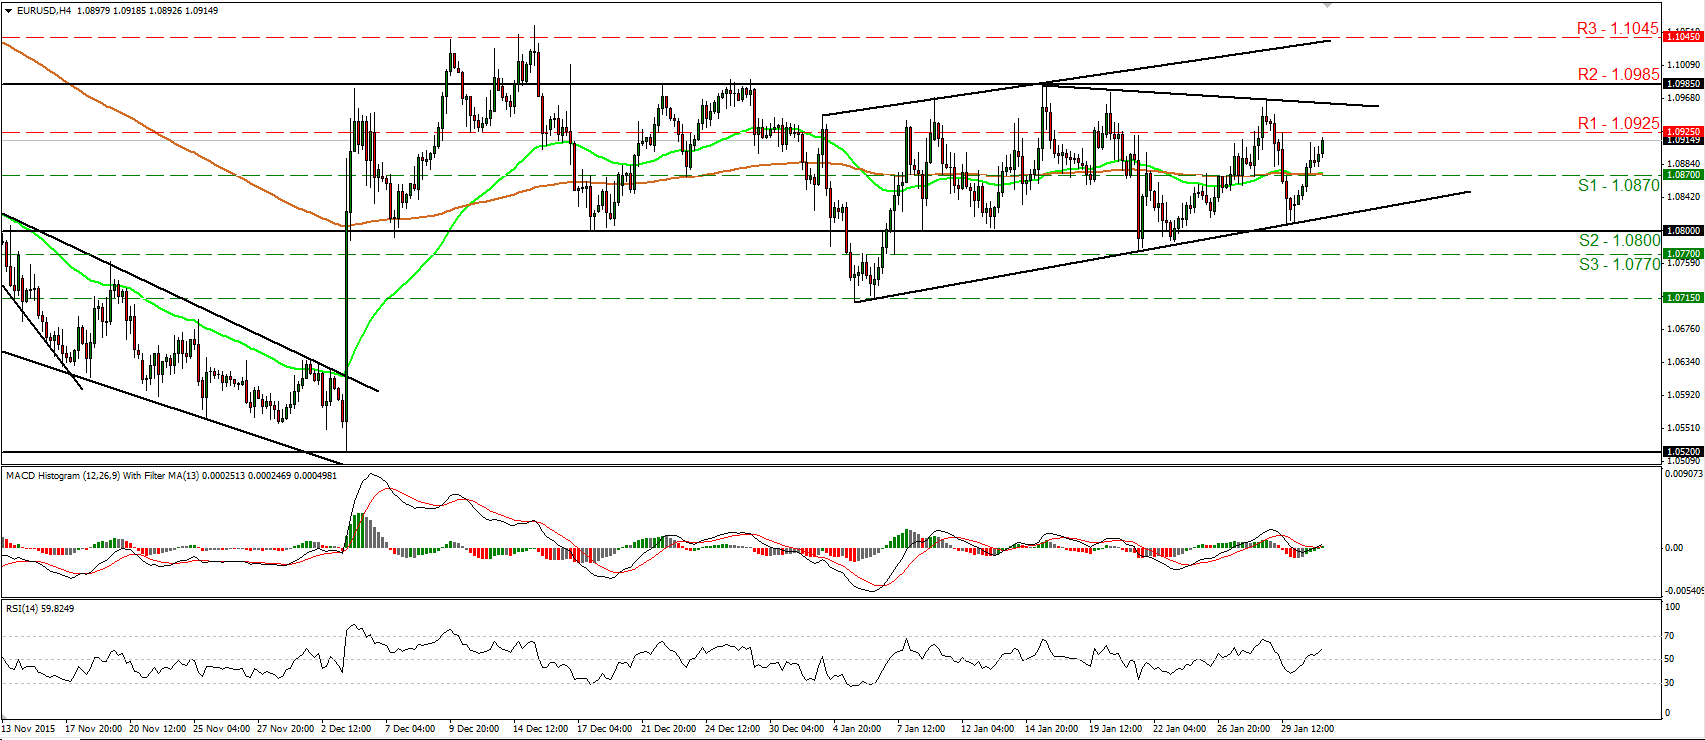
• EUR/USD traded higher on Monday, breaking above the resistance (now turned into support) barrier of 1.0870 (S1). The rate now looks to be headed for a test at 1.0925 (R1), where a clear break is possible to carry more bullish extensions and perhaps target the downside resistance line taken from the peak of the 15th of January or the 1.0985 (R2) resistance obstacle. Our short-term oscillators detect upside momentum and amplify the case for the pair to continue a bit higher. The RSI emerged above its 50 line and is now pointing up, while the MACD has bottomed slightly below zero, turned positive, and crossed above its trigger line. Nevertheless, although EUR/USD may continue higher for a while, given that it still oscillates between the 1.0800 (S2) zone and the resistance of 1.0985 (R2), I still consider the near-term trend to be to the sideways. As for the bigger picture, I will hold the view that as long as the pair is trading above the support obstacle of 1.0800 (S2), the longer-term picture stays flat as well.
• Support: 1.0870 (S1), 1.0800 (S2), 1.0770 (S3)
• Resistance: 1.0925 (R1), 1.0985 (R2), 1.1045 (R3)
GBP/USD edges higher and hits resistance at 1.4440
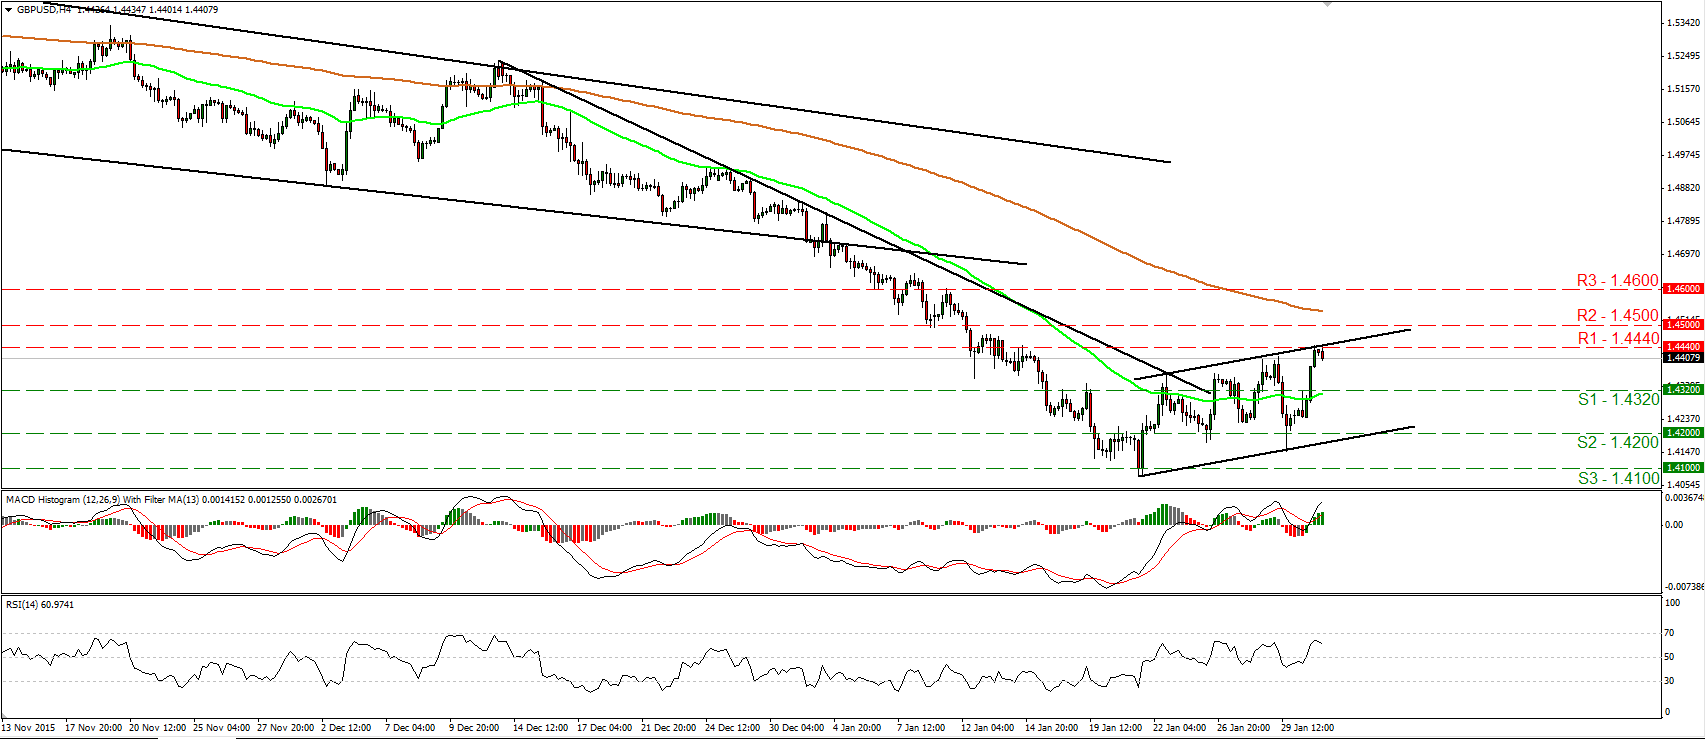
• GBP/USD traded higher yesterday after hitting the resistance barrier of 1.4440 (R1). As long as the rate is trading within the upside channel that has been containing the price action since the 21st of January, I would consider the near-term picture to be somewhat positive. I believe that a break above 1.4440 (R1) would initially aim for the psychological line of 1.4500 (R2). Nevertheless, given the pair’s proximity to the upper bound of the channel and taking a look at our short-term oscillators, I would expect the next wave to be a setback before the bulls decide to pull the trigger again, perhaps for a test at the 1.4320 (S1) support line. The RSI hit resistance slightly below its 70 line and turned down, while the MACD, although positive, shows signs that it could start topping. In the bigger picture, the price structure remains lower peaks and lower troughs below the 80-day exponential moving average, which is pointing down. Thus, I still see a negative longer-term picture and I would treat the recovery started on the 21st of January as a corrective phase for now.
• Support: 1.4320 (S1), 1.4200 (S2), 1.4100 (S3)
• Resistance: 1.4440 (R1), 1.4500 (R2), 1.4600 (R3)
AUD/USD slides following the RBA meeting
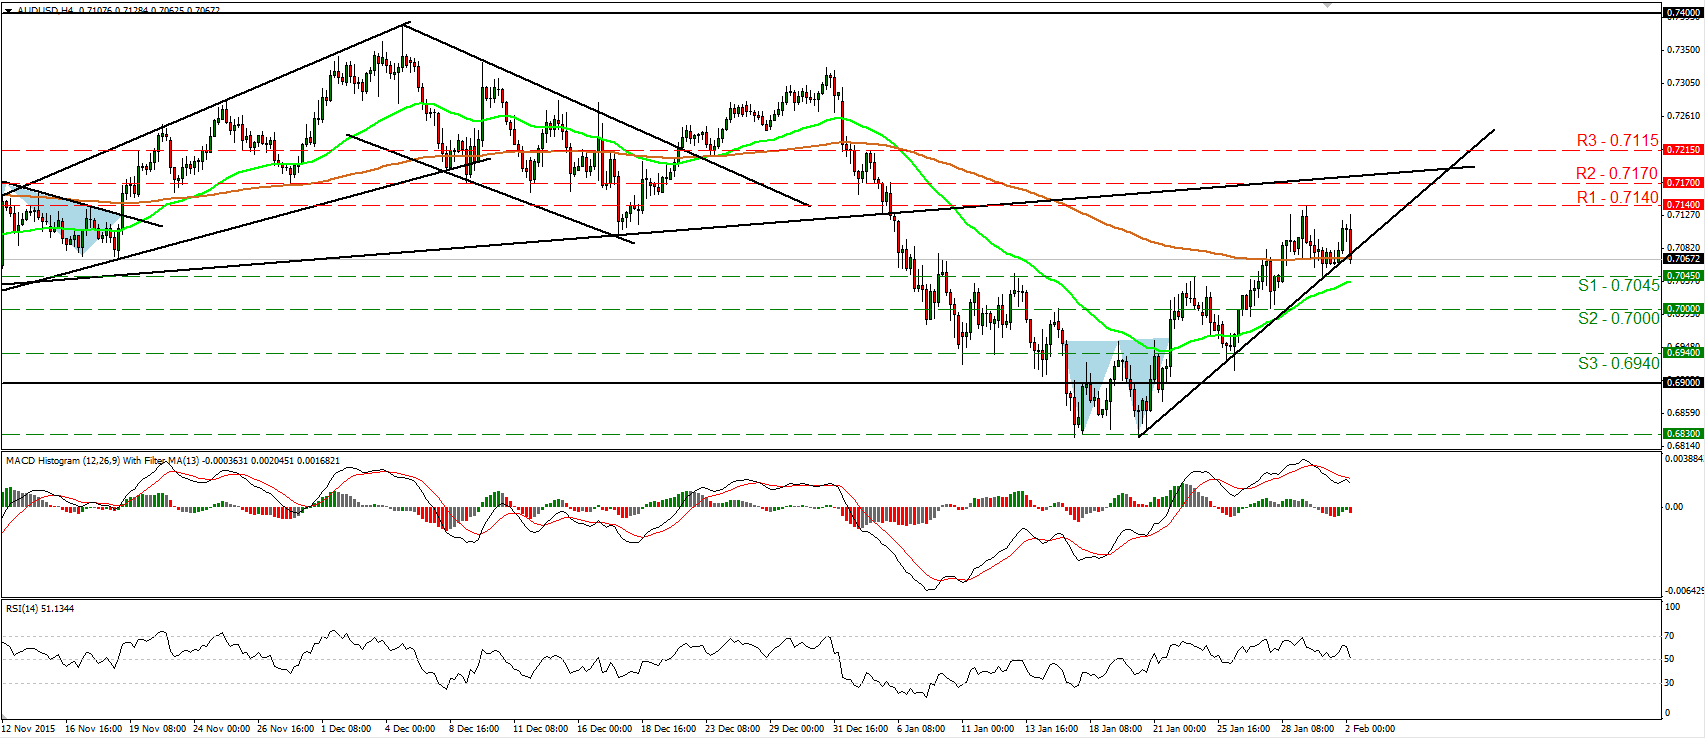
• AUD/USD traded higher yesterday but failed to reach the 0.7140 (R1) resistance line and during the Asian morning Tuesday, following the RBA policy meeting, the pair tumbled. The Bank held interest rates steady as expected and repeated that there is scope for further easing if future economic data warrants such a move. AUD/USD is now trading marginally below the short-term uptrend line taken from the low of the 20th of January. A clear move below the support of 0.7045 (S1) is likely to shift the near-term outlook somewhat negative and is possible to target the psychological zone of 0.7000 (S2). Looking at our momentum indicators, I see that the RSI turned down and looks able to fall below its signal line, while the MACD has topped and fallen below its trigger line. These indicators provide ample evidence that the pair is possible to continue trading lower for a while. On the daily chart, given that the rate is trading back within the sideways range between 0.6900 and 0.7400, I would hold a “wait and see” stance as far as the medium-term bias is concerned.
• Support: 0.7045 (S1), 0.7000 (S2), 0.6940 (S3)
• Resistance: 0.7140 (R1), 0.7170 (R2), 0.7115 (R3)
Gold breaks above the 1122 line
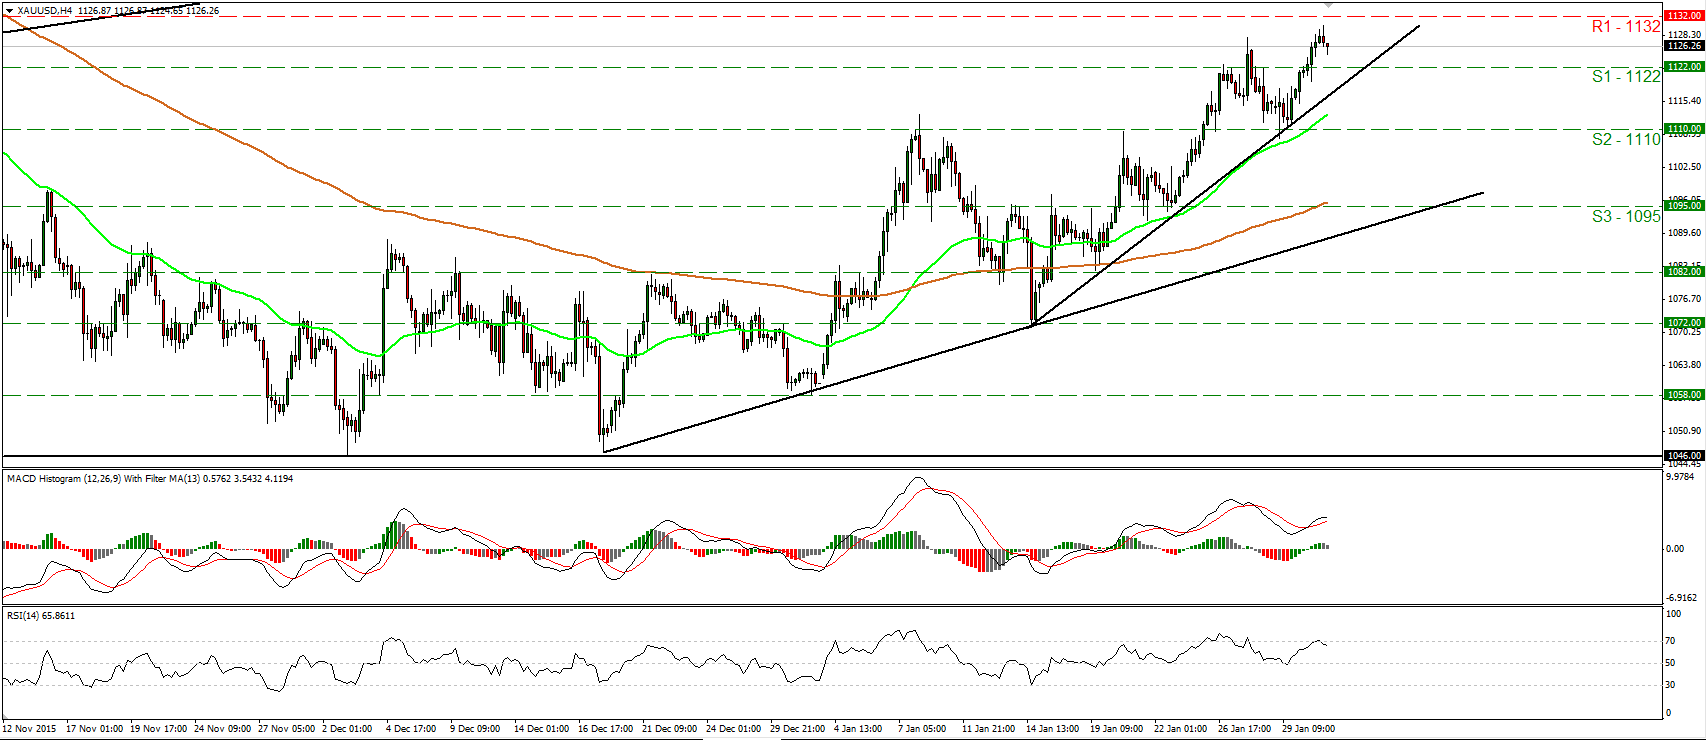
• Gold continued higher on Monday and managed to break above the resistance (now turned into support) line of 1122 (S1). The price structure remains higher peaks and higher troughs since the 14th of January and as a result, I still consider the near-term outlook to be positive. I would now expect the bulls to challenge the 1132 (R1) resistance line, where an upside break is possible to open the way for the next resistance at 1140 (R2). Taking a look at our short-term oscillators though, I see signs that a minor setback could be looming before the next positive leg. The RSI hit its 70 line and turned down, while the MACD, although above both its zero and trigger lines, shows signs that it could start topping. As for the broader trend, the break above 1110 (S2) on the 26th of January has confirmed a forthcoming higher high on the daily chart, something that keeps the medium-term outlook somewhat positive.
• Support: 1122 (S1), 1110 (S2), 1095 (S3)
• Resistance: 1132 (R1), 1140 (R2), 1150 (R3)
DAX futures stay within a range
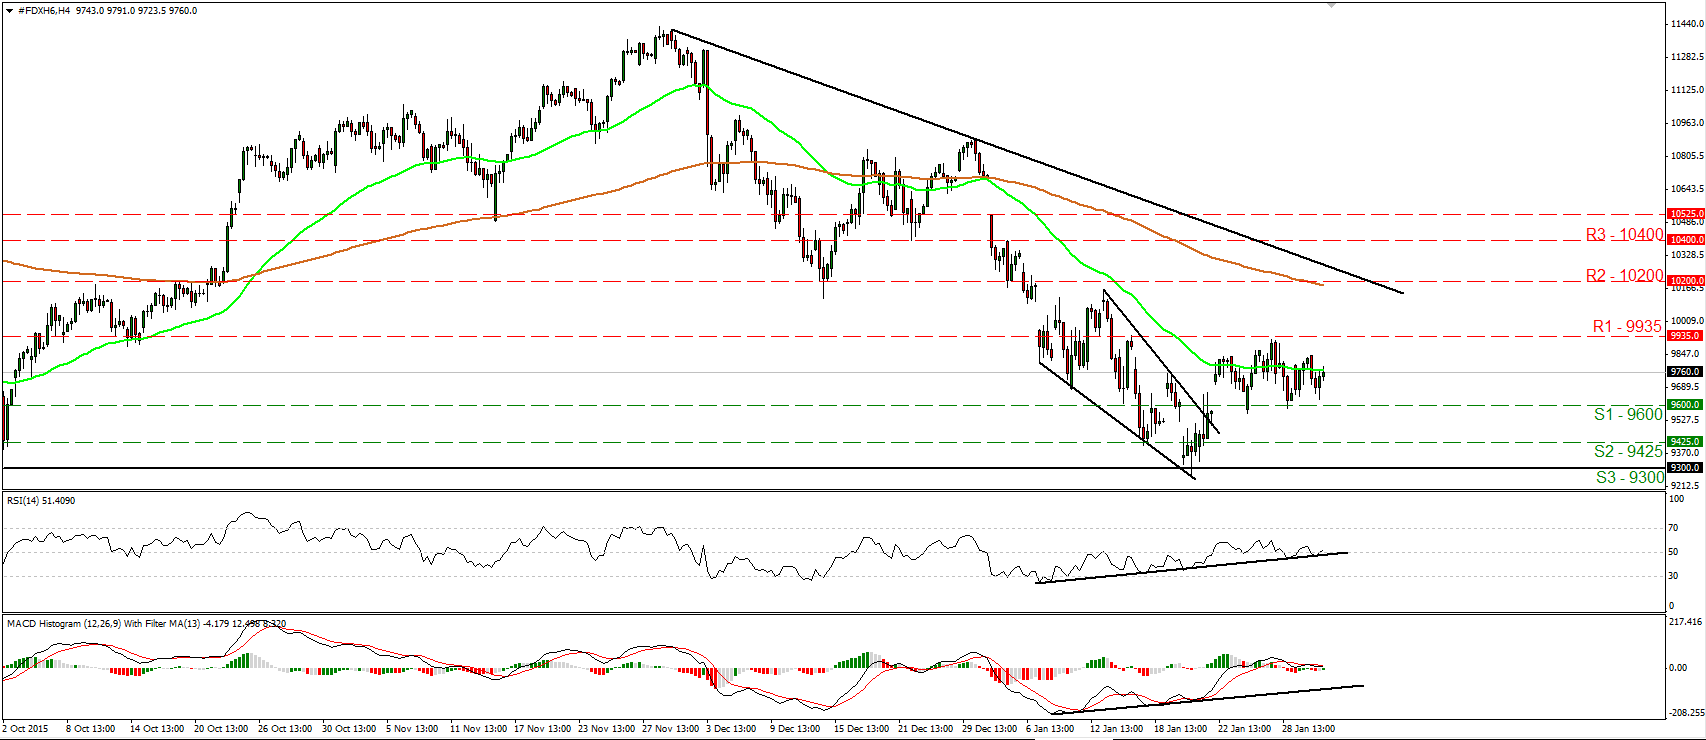
• DAX futures traded somewhat lower on Monday, but hit support marginally above 9600 (S1) and then they rebounded. The index stays between that support obstacle and the resistance zone of 9935 (R1) and as a result I would consider the short-term picture to be flat for now. A clear move above 9935 (R1) would confirm a forthcoming higher high on the 4-hour chart and could open the way for the next resistance territory of 10200 (R2). Looking at our short-term oscillators, I see that the RSI gyrates around its 50 line, while the MACD stands near its zero line and points sideways. These indicators confirm the recent consolidative mode of DAX. On the daily chart, I see that since the 1st of December the index has been printing lower peaks and lower troughs, something that keeps the longer-term picture negative. As a result, I would treat the recovery from the 20th of January, or any extensions of it, as a corrective phase for now.
• Support: 9600 (S1), 9425 (S2), 9300 (S3)
• Resistance: 9935 (R1), 10200 (R2), 10400 (R3)


