🧐 ProPicks AI October update is out now! See which stocks made the listPick Stocks with AI

Ray Of Hope: Russel 2000 Finally Catching Up

Published 06/04/2017, 02:18 AM
Updated 07/09/2023, 06:31 AM
US500
-
US2000
-

I’m starting to see a few rays of hope from various measures of breadth that could provide the fuel for a broad based rally. The first comes from the Russell 2000 Index (RUT). It finally looks like it wants to play catch up with the other major indexes.
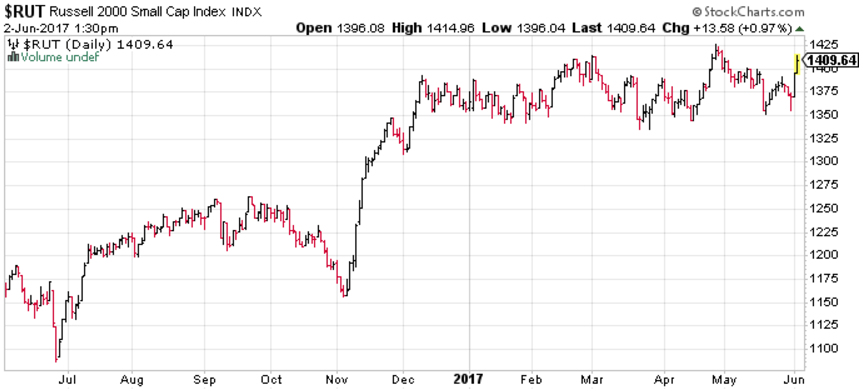
RUT Daily Chart

Another indicator that is showing some strength is the NYSE Cumulative Advance / Decline line (NYAD). It has broken higher with the market this week.
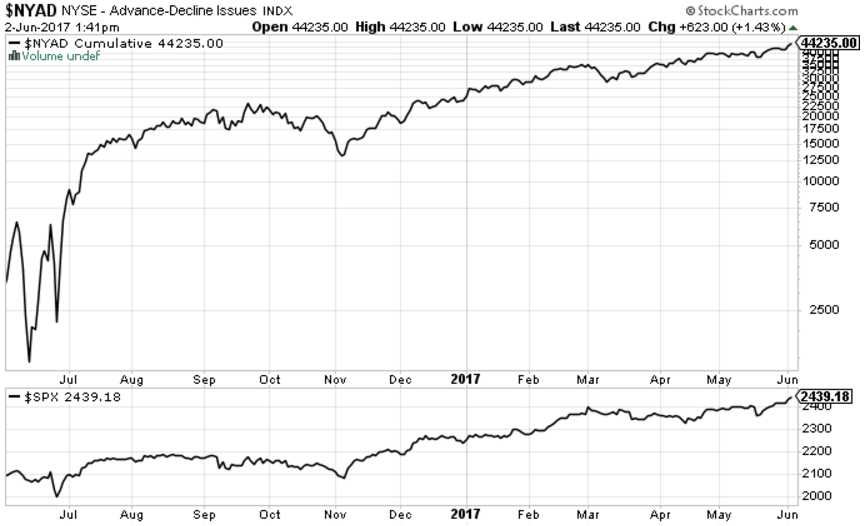
NYAD Chart

One last small ray of hope comes from the ratio between SPX and SPX Equal Weight. It turned up this week. If it can continue to rise it will help the market rise as money moves into large caps (and away from mega caps).
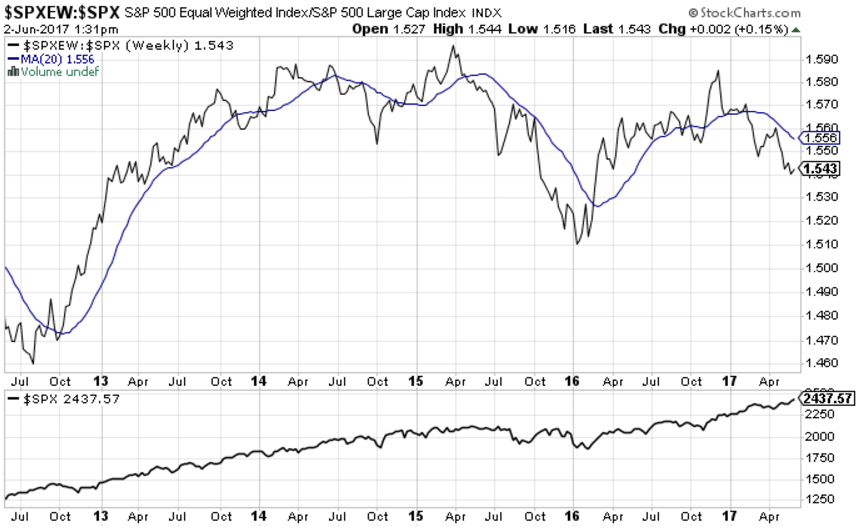
SPXEW-SPX Weekly

Unfortunately, there is a looming cloud over the ray of hope. My only category of core indicators that rose this week was measures of risk. All of the others fell. This is discouraging because it could indicate that the long term trend is getting much closer to ending.
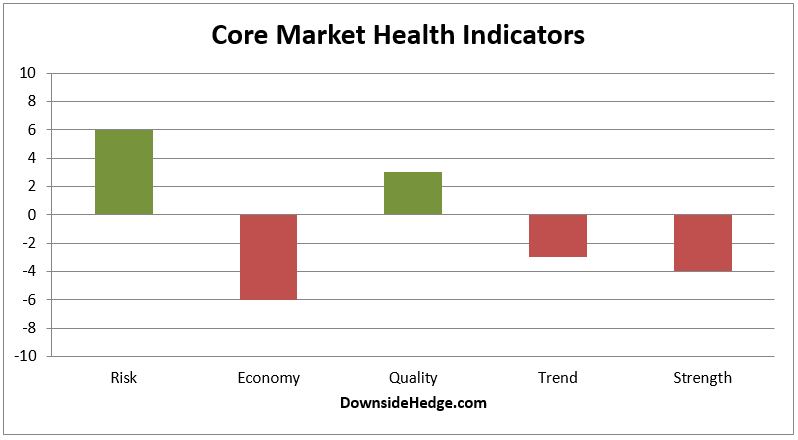
Core Market Health Indicators

Conclusion

Things are lining up for a broad based rally, but my core indicators aren’t confirming a move just yet. Keep an eye on the few rays of hope to point the direction of price over the next few weeks.

Latest comments

Loading next article…
Risk Disclosure: Trading in financial instruments and/or cryptocurrencies involves high risks including the risk of losing some, or all, of your investment amount, and may not be suitable for all investors. Prices of cryptocurrencies are extremely volatile and may be affected by external factors such as financial, regulatory or political events. Trading on margin increases the financial risks.
Before deciding to trade in financial instrument or cryptocurrencies you should be fully informed of the risks and costs associated with trading the financial markets, carefully consider your investment objectives, level of experience, and risk appetite, and seek professional advice where needed.
Fusion Media would like to remind you that the data contained in this website is not necessarily real-time nor accurate. The data and prices on the website are not necessarily provided by any market or exchange, but may be provided by market makers, and so prices may not be accurate and may differ from the actual price at any given market, meaning prices are indicative and not appropriate for trading purposes. Fusion Media and any provider of the data contained in this website will not accept liability for any loss or damage as a result of your trading, or your reliance on the information contained within this website.
It is prohibited to use, store, reproduce, display, modify, transmit or distribute the data contained in this website without the explicit prior written permission of Fusion Media and/or the data provider. All intellectual property rights are reserved by the providers and/or the exchange providing the data contained in this website.
Fusion Media may be compensated by the advertisers that appear on the website, based on your interaction with the advertisements or advertisers.
© 2007-2024 - Fusion Media Limited. All Rights Reserved.