Bullish borrowers have increased their margin debt to invest in stocks from $445 billion in January to $507 billion today. And why not? The overall price movement for growth sectors of the stock market remains healthy.
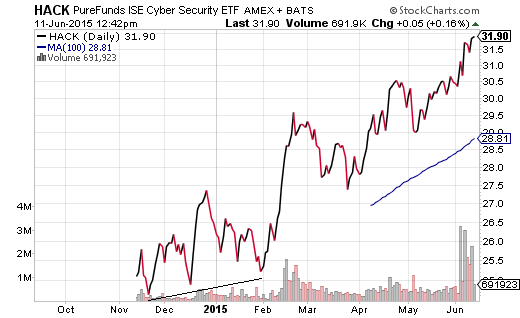
Flashy sub-segments like cyber-security and biotech continue to soar. For example, I allocated a small portion of moderately aggressive client assets to the Pure Funds ISE Cyber Security ETF (HACK) in early February. Its series of higher lows since its inception lent credibility to the notion of adding dollars to the high growth, high reward area.

Yet the belief that U.S. equities can stampede ahead indefinitely is sheer lunacy. Consider the reality that exports have been tumbling, labor productivity has been stalling and inventories (supply) have been rising significantly faster than sales demand. No matter how the media spin it, the economy is hurting. Now factor the economic headwinds into current and/or future corporate profits and revenue. What do you get? You come up with some of the highest price-to-sales (P/S), price-to-book (P/B) and price-to-earnings (P/E) ratios in the history of stock market valuation.
Who cares, right? “Follow The Fed” advocates argue that global central banks have orchestrated exceptionally easy terms for borrowing, making bonds unattractive and stocks the only place to stash money. They maintain that modest rate increases amount to little more than moving from ultra-accommodating policy to extremely accommodating policy. Still, amateur historians might wish to recount that rate hikes in questionable economic environments (e.g., 1929, 1948, 1980) were met with recessions and stock market bears. Others might want to address the historical truth that the epic collapses of the previous decade (i.e., 2000-2002, 2007-2009) occurred alongside a Fed that had been cutting rates aggressively.
Might I be more inclined to yield to a “don’t fight the Fed” reasoning if the 10-year were pushing 1%? I imagine I would be buying the harsh pullback that likely occurred along the way. If the 10-year were hugging 2%? I might expect stocks to hold serve. In contrast, the higher the 10-year climbs due to fears of an imminent tightening campaign, the more likely rate-sensitive stock assets will drag the broader market downward.
Remember, the S&P 500 has not witnessed a 10% correction in roughly four years. On the other hand, several rate-sensitive areas have already entered 10%-plus correction territory. Real estate investment trusts in Vanguard REIT (ARCA:VNQ) are off -11.4%, while utilities in the SPDR S&P (ARCA:SPY) Sector Select Utilities have dropped -13.2%.
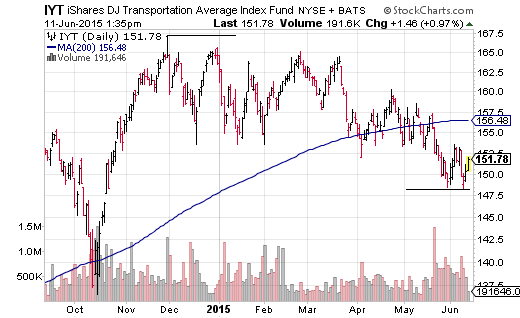
The hardship in the energy arena has been equally challenging. Broad-based energy corporations in SPDR Select Energy (ARCA:XLE) may be well off their March lows, but the influential sector fund is still down a bearish -21% from a 2014 pinnacle. Similarly, JP Morgan Alerian MLP (NYSE:AMJ) – hit by the double whammy of rising yields and price depreciation in crude/natural gas – currently resides in a bear cave with a -21.5% decline. Even the transporters in the iShares DJ Transportation ETF (ARCA:IYT) have witnessed intra-day depreciation of -11.5%; the current price of IYT is also below a long-term 200-day moving average.

For the record, I believe the bond rout is closer to running its course than marching forward. There is not much technical support for my belief, other than oversold Relative Strength Index (RSI) indications. Support for the 10 Year Treasury in and around 2.5% may even be a decent entry point for government bond investors. Consider iShares 7-10 Year Treasury (ARCA:IEF).
The U.S. 10-year is trading 10 basis points lower at 2.4% on Thursday. If you had a choice between owning Spain's 10-year sovereign debt at 2.1%, Germany’s 10-year bund at 0.9%, or the U.S. 10-year at 2.4%, which would you choose?
(Note: I recognize that many would choose “None of the Above.” Nevertheless, foreign investors, pension funds and central banks all require government debt; the supply is limited. The dramatic taper tantrum in bonds that occurred in 2013 reversed itself in 2014. Similarly, the bond rout to this point in 2015 is likely to see a sharp reversal in the 2nd half of 2015 or in early 2016.)
On the whole, depending on the client, cash levels have been raised to 10%-25%. I have lowered stock and fixed income exposure due to the execution of stop-limit loss orders as well as the elevated correlations across asset classes; the elevated correlations make it particularly difficult to protect portfolios with traditional diversification. In contrast, a tactical asset allocation decision to raise cash makes it possible to acquire shares of stock or bond ETFs at lower prices in the future.
Disclosure: Gary Gordon, MS, CFP is the president of Pacific Park Financial, Inc., a Registered Investment Adviser with the SEC. Gary Gordon, Pacific Park Financial, Inc, and/or its clients may hold positions in the ETFs, mutual funds, and/or any investment asset mentioned above. The commentary does not constitute individualized investment advice. The opinions offered herein are not personalized recommendations to buy, sell or hold securities. At times, issuers of exchange-traded products compensate Pacific Park Financial, Inc. or its subsidiaries for advertising at the ETF Expert web site. ETF Expert content is created independently of any advertising relationships.
