Crane Co. (NYSE:CR) reported better-than-expected results for the second quarter of 2019, with earnings surpassing estimates by 1.9%. This is the company’s 15th consecutive quarter of recording impressive results. Along with this, it impressed shareholders with an announcement of paying a quarterly dividend.
Adjusted earnings in the reported quarter were $1.58 per share, surpassing the Zacks Consensus Estimate of $1.55. On a year-over-year basis, the bottom line increased 12.1%, driven by margin improvement.
Revenues Decline Y/Y
In the quarter under review, Crane’s net sales were $841.6 million, reflecting a decline of 1.1% from the year-ago quarter. The results suffered from forex woes of 1.9% and adverse impact of 0.2% from divestitures, partially offset by organic sales growth of 1%.
However, its net sales surpassed the Zacks Consensus Estimate of $836.5 million.
The company reports net sales under four segments — Fluid Handling, Payment & Merchandising Technologies, Aerospace & Electronics, and Engineered Materials. The segmental information is briefly discussed below:
Revenues from the Fluid Handling segment were $290.6 million, reflecting growth of 4.9% from the year-ago quarter figure. Organic sales in the quarter grew 8%, which were partially offset by unfavorable movements in foreign currencies of 3%. This segment’s order backlog was $274.9 million in the reported quarter, reflecting a sequential decline of 3.5%.
Revenues from Payment & Merchandising Technologies totaled $291 million, decreasing 10.3% year over year. Organic sales in the quarter declined 8% while forex woes had adverse impact of 2%. Divestitures had negative impact of $1 million. Order backlog at the end of the reported quarter was $286.8 million, down 11% sequentially.
Revenues from the Aerospace & Electronics segment were $204.5 million, increasing 9.2% year over year. This improvement was mainly driven by core sales growth. Order backlog at the end of the quarter under review was $502.8 million, up 3.2% sequentially.
Revenues from the Engineered Materials segment decreased 11.3% year over year to $55.5 million due to weak business in the recreational vehicle end market. Order backlog at the end of the reported quarter was $11.5 million, down 6.5% sequentially.
Operating Margin Improves Y/Y
In the second quarter, Crane’s cost of sales declined 1.9% year over year to $535 million. It represented 63.6% of net sales compared with 64.1% in the year-ago quarter. Selling, general and administrative expenses decreased 1.4% year over year to $183.8 million. It represented 21.8% of net sales versus 21.9% in the year-ago quarter.
Adjusted operating income in the quarter under review increased 9% year over year to $131.6 million. Moreover, adjusted operating margin increased 140 basis points to 15.6%.
Balance Sheet and Cash Flow
Exiting the second quarter, Crane had cash and cash equivalents of $307 million, up 19.5% from $256.8 million at the end of the last reported quarter. Long-term debt balance was roughly flat sequentially to $940.3 million.
In the second quarter, the company generated net cash of $152.9 million from operating activities, suggesting an increase from $57.3 million generated in the year-ago quarter. Capital expenditure was $16.3 million, down 1.2% from the year-ago quarter. Free cash flow in the quarter was $136.6 million versus $40.8 million in the year-ago quarter.
Shareholder-Friendly Policy
In the second quarter, Crane used $23.3 million for paying dividends, with roughly $20.9 million distributed in the year-ago comparable quarter.
Concurrent with the earnings release, the company announced that its board of directors approved the payment of a quarterly dividend of 39 cents per share to shareholders of record as of Aug 31, 2019. The dividend payment will be made on Sep 9.
Outlook
In the quarters ahead, Crane is likely to benefit from growth investments, acquired assets, repositioning initiatives and focus on the development of products.
For 2019, the company maintained adjusted earnings per share projection at $6.25-$6.45. The projection suggests growth of 6% at the mid-point from the year-ago reported number. This excludes integration costs related to acquired assets of 7 cents and repositioning costs of 18 cents.
Revenues for the year will likely be $3.3 billion. Core sales will be down slightly and forex woes will represent a 2% headwind. Operating cash flow in the year is anticipated to be $425-$455 million and capital expenditure is expected to be $90 million. Free cash flow is projected to be $335-$365 million.
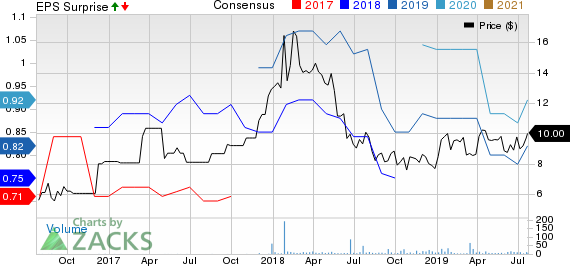
Barloworld Ltd. Price, Consensus and EPS Surprise
Crane Company (CR): Free Stock Analysis Report
Barloworld Ltd. (BRRAY): Free Stock Analysis Report
General Electric Company (GE): Free Stock Analysis Report
Danaher Corporation (DHR): Free Stock Analysis Report
Original post

