NVDA Q3 Earnings Alert: Why our AI stock picker is still holding Nvidia stockRead More

Quick Update — Emerging Markets: STI, HSI, NIFTY

Published 07/13/2016, 02:54 AM
Updated 07/09/2023, 06:31 AM
HK50
-
NSEI
-

With the recent resurgence in the US indices and the potential new leg up in the 2009 bull market, we took a look at the foreign indices we track. The objective was to find indices that had dramatic selloffs during 2015-2016, and appear to have completed bear markets. Of the twenty indices we track, three in particular look the best longer term.
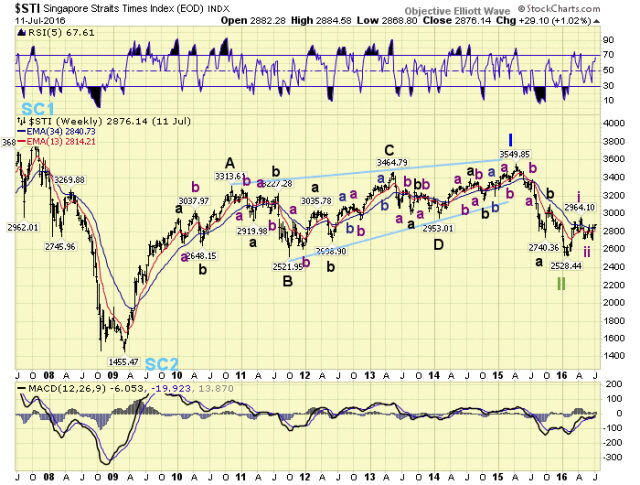
STI Weekly Chart

Singapore had a terrific advance between 2009 and 2010, rising about 150%. Then for the next five years it formed a diagonal triangle which ended in early 2015. The 2015-2016 bear market took the STI within 6 points of the B wave low in 2011. A classic retracement.

At the low, the monthly, weekly and daily charts displayed positive divergences. Off the February 2016 low the STI rallied in five waves, then formed a flat correction. It recently confirmed a new uptrend.
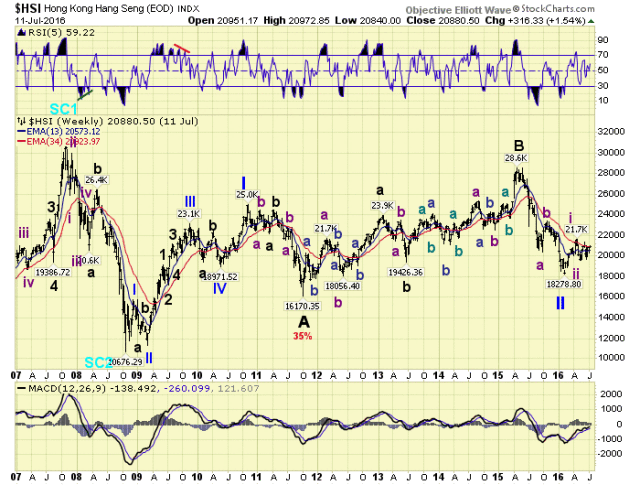
HSI Weekly Chart

Hong Kong formed a much different pattern after its 150% rise from 2008-2010. It declined in an A wave into a 2011 low, rallied in a corrective B wave into a 2015 high, then dropped in a C wave into its recent February low.

The C wave did not fully retrace back to the A wave low, so it looks like a failed C. At that low its also had positive divergences on its monthly, weekly and daily charts. It then impulsed higher in 5 waves into April, corrected into May, and is currently in an uptrend.
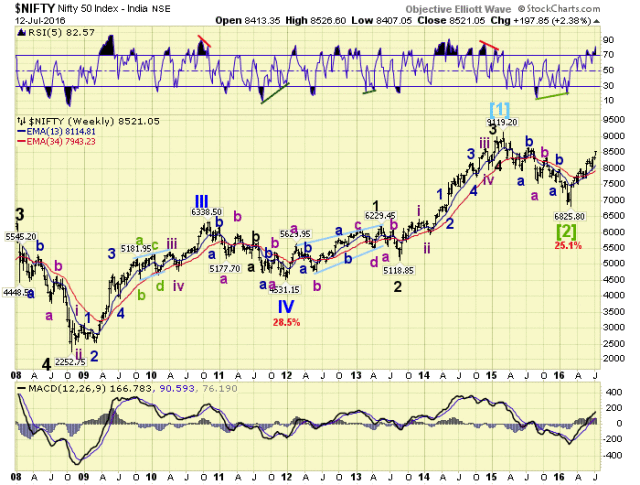
NIFTY Weekly Chart

India has had two bull markets and two bear markets since its 2008 low. It nearly tripled in two years during the first bull, dropped 29%, then more than doubled again during the second bull market.

During the recent bear market it dropped 25%, made a low in February, and has been in an uptrend ever since. This uptrend looks similar to the third waves in each of the bull markets. This suggests that, since it is only a first wave, a potential big move is underway.

Latest comments

Loading next article…
Risk Disclosure: Trading in financial instruments and/or cryptocurrencies involves high risks including the risk of losing some, or all, of your investment amount, and may not be suitable for all investors. Prices of cryptocurrencies are extremely volatile and may be affected by external factors such as financial, regulatory or political events. Trading on margin increases the financial risks.
Before deciding to trade in financial instrument or cryptocurrencies you should be fully informed of the risks and costs associated with trading the financial markets, carefully consider your investment objectives, level of experience, and risk appetite, and seek professional advice where needed.
Fusion Media would like to remind you that the data contained in this website is not necessarily real-time nor accurate. The data and prices on the website are not necessarily provided by any market or exchange, but may be provided by market makers, and so prices may not be accurate and may differ from the actual price at any given market, meaning prices are indicative and not appropriate for trading purposes. Fusion Media and any provider of the data contained in this website will not accept liability for any loss or damage as a result of your trading, or your reliance on the information contained within this website.
It is prohibited to use, store, reproduce, display, modify, transmit or distribute the data contained in this website without the explicit prior written permission of Fusion Media and/or the data provider. All intellectual property rights are reserved by the providers and/or the exchange providing the data contained in this website.
Fusion Media may be compensated by the advertisers that appear on the website, based on your interaction with the advertisements or advertisers.
© 2007-2024 - Fusion Media Limited. All Rights Reserved.