Have you studied the history of stocks in the U.S? Most people are aware of the crash in 1929 as well as the capital depreciation that occurred through 1932. Yet many may not be aware of the government stimulus in 1933 that helped the market soar 200% over the next four years. While the stimulus may have aided in pulling the markets higher in the absence of organic economic growth, stocks eventually tanked nearly 50% in a ferocious 1-year bear (3/10/1937-3/31/1938).
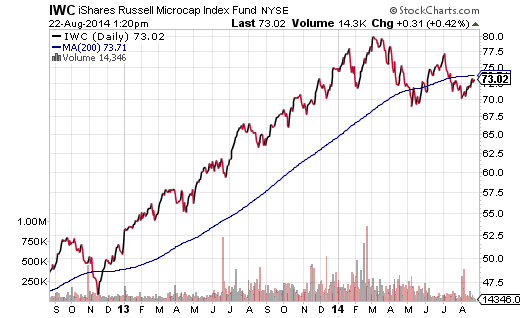
It is fair to say that the Federal Reserve’s zero percent rate policy coupled with trillions of electronically created dollars has had a hand in propping up the U.S. economy. Are you comfortable with the idea that they may transition to “normalizing” overnight lending rates? If so, why are the smallest company stocks in iShares Russell Microcap Index (NYSE:IWC) collectively down more than 9% from their February highs? Why is IWC struggling below its 200-day trendline?
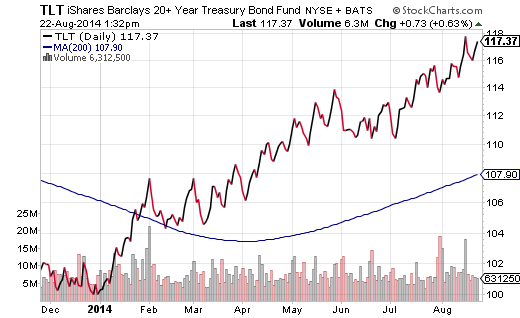
If the U.S. economic recovery is for real – if it no longer needs the benefit of extraordinary measures by the U.S. Federal Reserve – shouldn’t we see a steepening of the yield curve? Instead, long-term Treasury bonds have been highly coveted throughout 2014. Bond bulls clearly do not believe things will go well in the absence of Fed support. Bond believers could be wrong, of course. Yet what gives a U.S. stock bull the confidence to ignore the worrywarts who are winning with iShares Barclays 20+ Year Treasury (ARCA:TLT)?
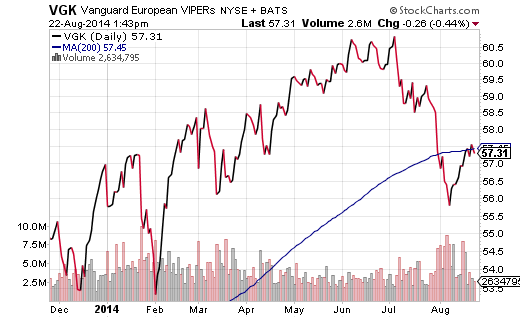
There are those who would say that U.S. stocks actually hit bear market percentage losses in 2011. Others can quibble about whether the S&P 500 or the Wilshire 5000 or another representative index fell 20% or more from its highs. However, it is certainly worth remembering that Europe’s recession, as well as fears of a financial collapse over sovereign debt woes, dragged down U.S. equities three years ago. Is it in any way disturbing that European monetary policy has failed to get the euro-zone economy expanding? Vanguard MSCI EU (ARCA:VGK) is back below its long-term moving average and it is 6% off its 52-week peak. Does the eroding faith in European stocks shake your faith in the U.S. stock market?
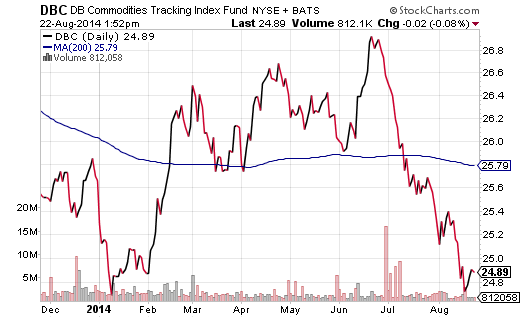
If you do believe the U.S. economy is part of a worldwide economy, are you bothered by capital depreciation across the commodity space? U.S. equities thrived alongside commodity demand in the previous decade; they faltered in the absence of that demand during the two previous recessions. Is the downtrend for PowerShares DB Commodity Index (ARCA:DBC) perplexing in any shape or form?
Analysts at SG Securities estimate that corporations spent 20% last quarter on share buybacks. Recognizing that share buybacks reduce supply – understanding that corporate purchases have been a part of the demand side of the equation – does the change ring any alarm bells? There are scores of different methods for determining whether stocks are undervalued, fairly values or overvalued. Most of those methods scream overvaluation. Why should an investor with cash on hand add more U.S. equity exposure when tired-and-true metrics suggest waiting for cheaper prices?
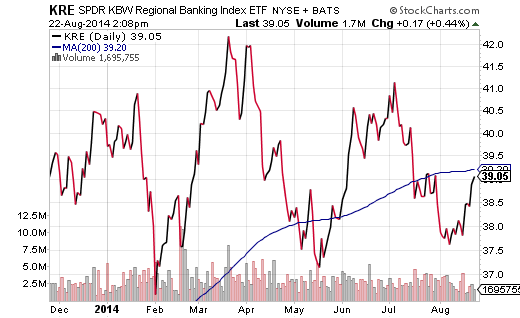
Some stock bulls have argued that we are in the pre-season of a merger-and-acquisition phase. Moreover, with the biggest banks profiting from their government-infused capital structure, one might reasonably assume that regional banks would benefit from takeover fever. Heck, shouldn’t shares of regional banks be surging on the “healthy” demand for real estate? Yet SPDR SPDR KBW Regional Banking (NYSE:KRE) is not showing any stamina.
Having asked so many questions of U.S. stock ETF bulls, one might erroneously assume that I am bearish. On the contrary. Until large-cap stock ETFs in the S&P 500 fall below a 200-day moving average, the trend suggests that one should participate. Yet throughout the year, I have drilled home two key points: (1) Use a barbell approach and (2) Have a sell strategy in place. The ETFs that I am using for that barbell include Vanguard Extended Duration (EDV) and iShares USA Minimum Volatility (USMV).

