All the major silos of U.S. equity factors are posting solid gains this year, but nothing beats the so-called quality screen (stocks with strong fundamentals), based on a set of exchange traded funds. In close pursuit: large-cap shares.

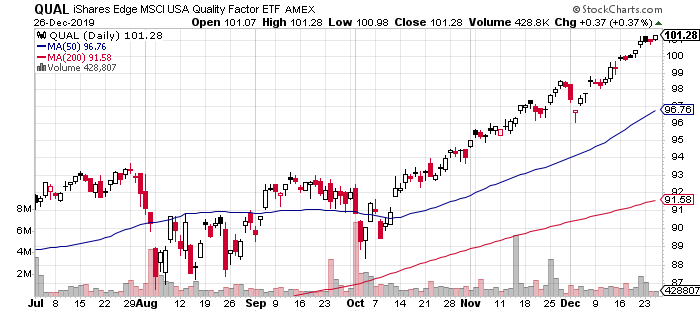
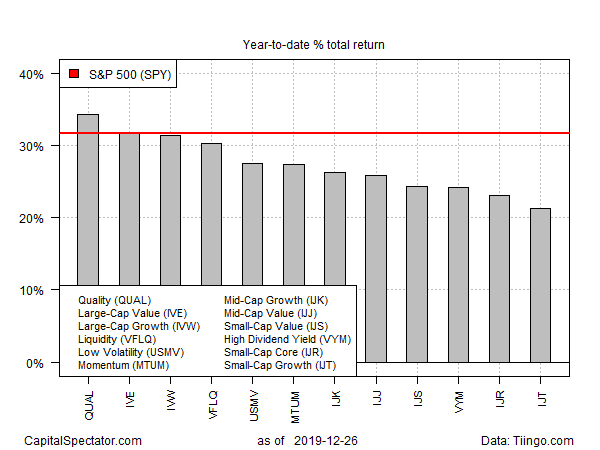
Leading the factor horse race in 2019 by a moderate degree: iShares Edge MSCI USA Quality Factor (NYSE:QUAL), which has an impressive 34.3% total return this year through yesterday’s close (Dec. 26). Since early October, the fund’s rise has been a virtually non-stop bull run that’s lifted the ETF to a record close on Thursday.
Large-cap stocks generally are strong performers this year as well, second only to QUAL. The iShares S&P 500 Value (NYSE:IVE) and iShares S&P 500 Growth (NYSE:IVW) are neck-and-neck for year-to-date results. Each of these large-cap factor funds is up roughly 31%-plus so far this year.
Note, too, that the market overall — based on SPDR S&P 500 (SPY (NYSE:SPY)), which is effective a core large-cap portfolio – is also a top performer, posting a 31.8% total return so far for 2019 – just ahead of IVW and fractionally behind IVE.

There are no losers for U.S. equity factor performances this year, although in relative terms small-cap growth is the runt of 2019’s performance litter. The iShares S&P Small-Cap 600 Growth (NASDAQ:IJT) is ahead by a comparatively soft 21.4% in 2019. Such is the strength of the 2019 rally that a 20%-plus gain for the year constitutes a “weak” gain.
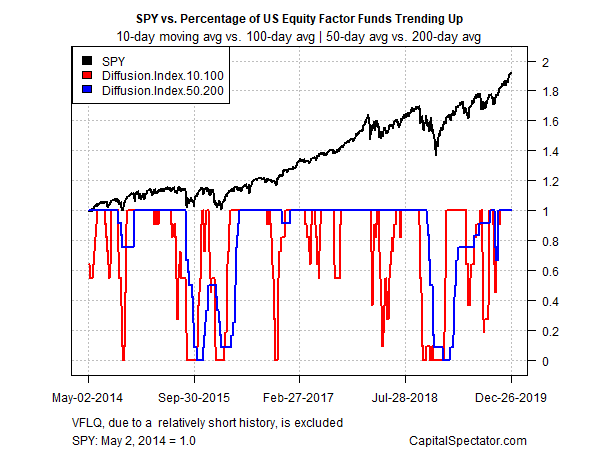
After such an remarkable run this year the first question centers on the obvious: Will the rally continue? As always, the answer to such things remains unknown to mere mortals. That said, the bulls will find encouragement in profiling the state of momentum, which remains bullish in no trivial degree, based on a set of moving averages for each of the funds listed above.
The first measure compares the 10-day moving average with its 100-day counterpart — a proxy for short-term trending behavior (red line in chart below). A second set of moving averages (50 and 200 days) represents an intermediate measure of the trend (blue line). According to this momentum lens, all the factor funds (along with the SPY (NYSE:SPY) broad-market proxy) are enjoying upside trending behavior as we go into the final stretch of trading for 2019.

