In terms of the technicals, the technology sector is way overbought.
The energy and telco sectors are way oversold.
There are far better technicians than me that you can read every day on Twitter, TheStreet, Seeking Alpha, and the various Wall Street blogs, so take the above with a grain of salt. Sectors in uptrend’s and showing good relative strength can remain that way for years, and sectors in downtrends can behave the same.
It’s triathlon season here in Chicago so if there is an earnings update occasionally missed or you see it during the week, rather than the typical Saturday morning, you know.
Roughly 100 of the S&P 500 have reported Q2 ’17 earnings, and the “estimated” SP 500 Q2 ’17 earnings growth has risen to +9.6% from July 1’s growth estimate of +8%.
Thomson Reuters data (by their numbers):
- Fwd 4-qtr estimate: $138.62 vs last week’s $138.90
- P.E ratio: 17.8(x)
- PEG ratio: 1.85(x)
- SP 500 earnings yield: 5.6% still pretty healthy as the forward estimate grows faster than the increase in the SP 500
- Year-over-year growth of fwd est: +9.62% vs last week’s 9.63%
Analysis / conclusion: Technology is the focus this week as we hear from Google (NASDAQ:GOOGL) Monday night, Facebook (NASDAQ:FB) Wednesday night, and Amazon (NASDAQ:AMZN) Thursday night. (Long all 3 names).

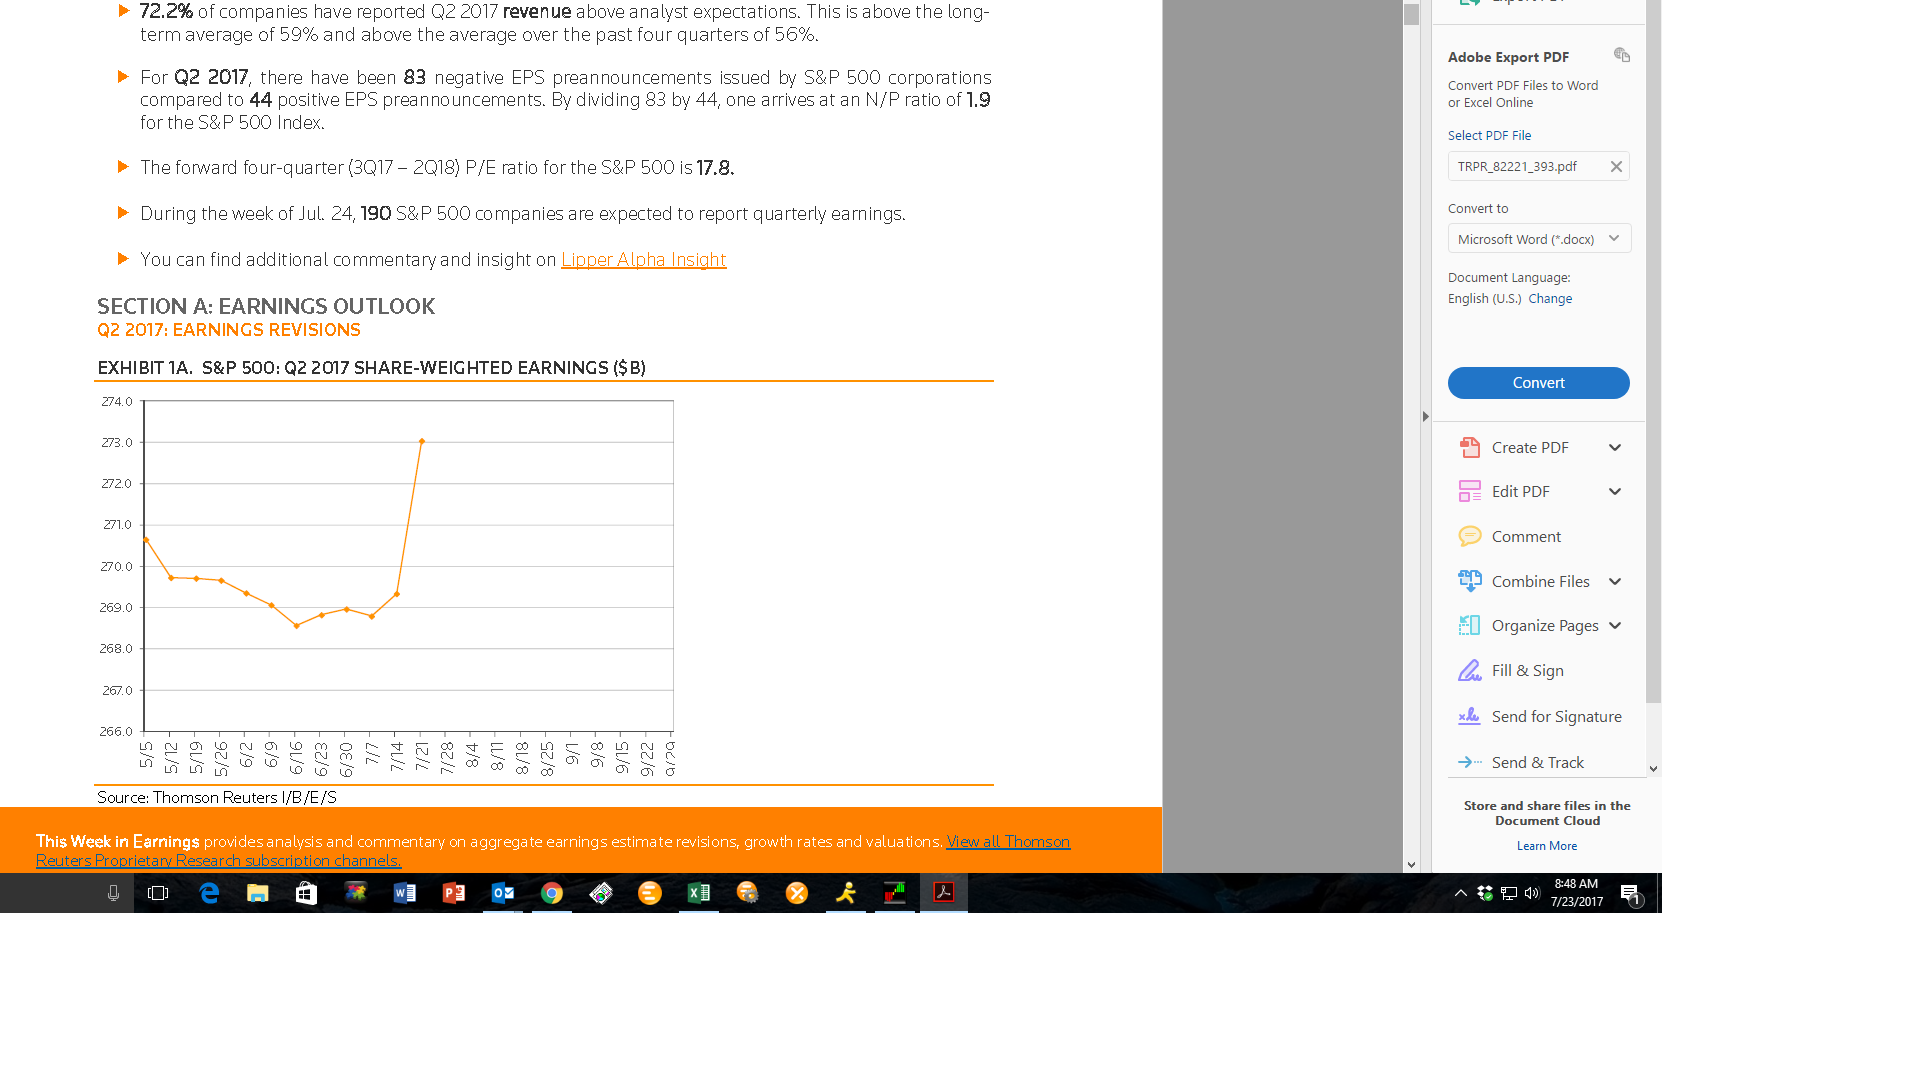
The attached link is from the cover page of “This Week in Earnings” Thomson Reuters I/B/E/S weekly earnings analysis that is published every Friday.
I've been looking at that graph for 20 years and this week it shows perfectly how dollar earnings (not EPS) estimates drift lower through the quarter and then get revised higher as the quarter starts to get reported.
This quarter could be seeing an additional benefit from the weak dollar, down 6% – 7% YTD per some mainstream media although the media isn't saying whether that is the trade-weighted dollar, the DXY or some other dollar proxy.
The Energy sectors growth rates can be deceptive: the sector is coming off very depressed growth in 2016, so while the percentage growth looks outsized, the dollar earnings remain just average. (A separate post needs to be done on this, but – like a lot of writing – it is gotten to when it can.)
Q2 ’17 Expected Earnings growth Ranked highest to lowest by sector:
- Energy: +540%
- Tech: +16.3%
- Financials: +11.8%
- Industrials: +4.8%
- Cons Staples: +3.3%
- Basic Materials: +3.3%
- Health Care: +3.0%
- Real estate: +2.8%
- Cons Disc: +1.0%
- Telco: +0.9%
- Ute’s: -3.8%
Note Energy’s percentage growth – the sector is oversold and could pop. Readers need to see the forward quarters and how those growth rates are behaving, though.
Technology and financials are 35% – 37% of the SP 500 by market cap. That is where your “market performance” is coming from.
