The following Weekly charts are illustrations of one of our proprietary price modeling systems that shows trends, market breadth and much more. We use this almost exclusively on longer-term (Weekly, Monthly, and Quarterly charts) to help us understand where longer-term support and resistance levels are, where the market ranges are truly important and to determine true market breadth. When we are studying Daily chart or intra-day charts – the shorter term price rotation can often clutter our interpretation of the long term expectations. Yes, we have other modeling systems, predictive analysis systems, Fibonacci systems, Adaptive Cycles systems and more. Our collection of proprietary analysis tools is very deep. Yet, one has to know how to use these tools and what value they can provide at different times.
This proprietary modeling system is designed to model price swings/rotation and provide clear overall objective analysis of key price levels/pivots. We call it “TT Charger”.
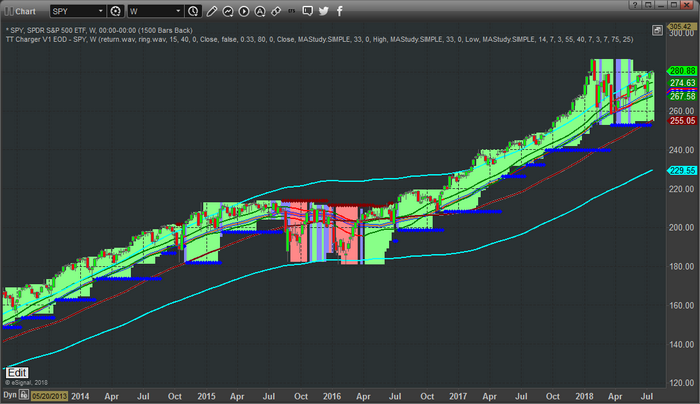
Weekly chart of the SPY (NYSE:SPY) using our TT Charger modeling system
This first Weekly chart of the SPY using our TT Charger modeling system is clearly still bullish. The price breadth contracting a bit near the current prices and support is currently functioning near $252. The current market price has recently broken higher above the short term price channels in addition to the longer term price channels. This is a pretty good indication that price may attempt another rally attempt that may extend for many weeks. In 2017, we witnessed more than 5 to 15+ weeks of extended price rally above both of these channel levels at times. The recent rotation in February 2018 may operate as a “recharging of price” in terms of a future rally attempt.

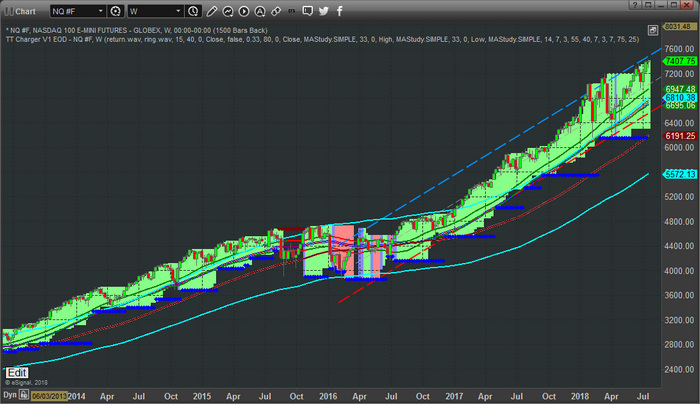
Weekly NQ chart with the TT Charger
This Weekly NQ chart with the TT Charger applied for shows an even more incredible setup. Support is currently setting near $6190 and price has extended beyond both of the price channels for more than 11 weeks now. Market Breadth is expanding, therefore the implied volatility is increasing as well. Although we may not see a very big volatility rotation in price, the capability of increased volatility is still valid.

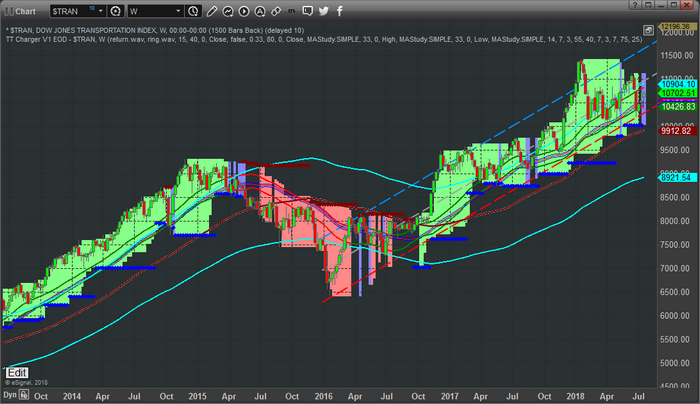
Weekly Transportation Index chart
This Weekly Transportation Index chart paints a clearer picture of the struggling Transportation Index in terms of the recent price rotation. The TT Charger analysis still shows a solidly bullish price trend with support at $10,005. Price is within the longer term price channels and just above the shorter term price channel. The Transportation index typically leads the US equities markets by about 4~8 months, so it is important that we see the Transportation index rally in support of the equities markets rally. If this fails to happen, then we are likely experiencing a “capital appreciation” that is not supported by economic fundamentals. In other words, without a rally in the Transports, any price advance in the equities markets is likely short-lived (3~6 months at best) before one of the two will break.

At this point, our interpretation of these charts is that the US earnings season should drive equities prices higher, within and above these price channels, and create a real opportunity for investors/traders. Yes, support is quite a bit below the current price levels, but these support models will adjust as price advances. Unless a reversal trigger is generated, which does not seem likely right now, or the support levels are broken, which is not likely right away, we should be looking for advancing prices and breakout rallies over the next few weeks or months.
