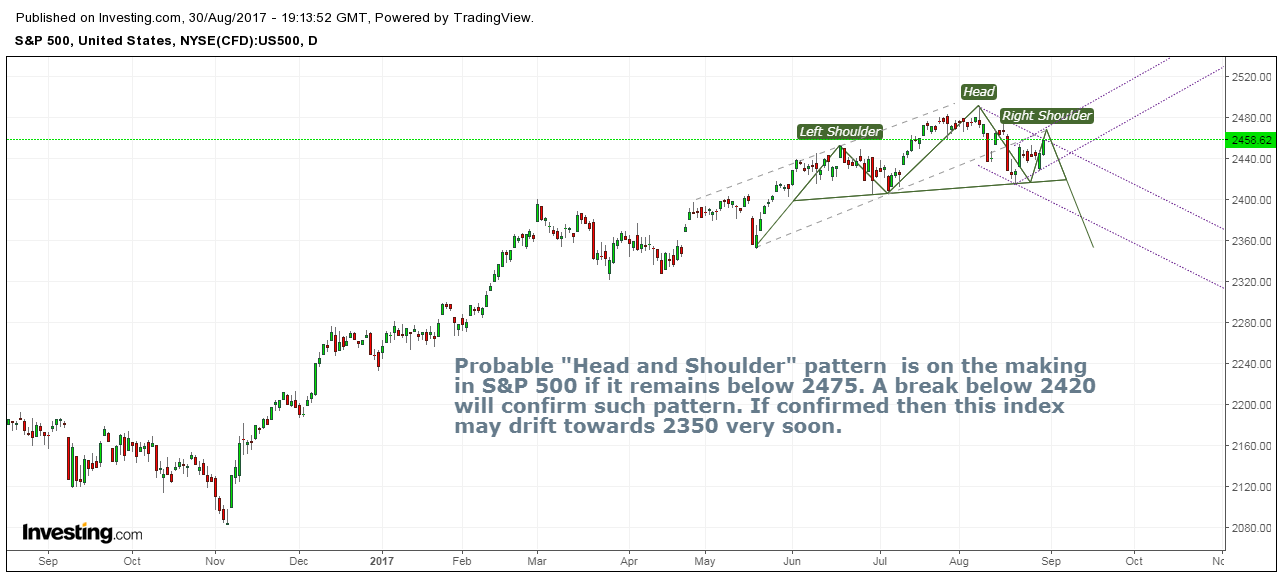
Probable "Head and Shoulder" pattern is on the making in S&P 500 if it remains below 2475. A break below 2420 will confirm such pattern. If confirmed then this index may drift towards 2350 very soon. However, a break above 2475 will invalidate any probility of "Head and Shoulder" pattern.
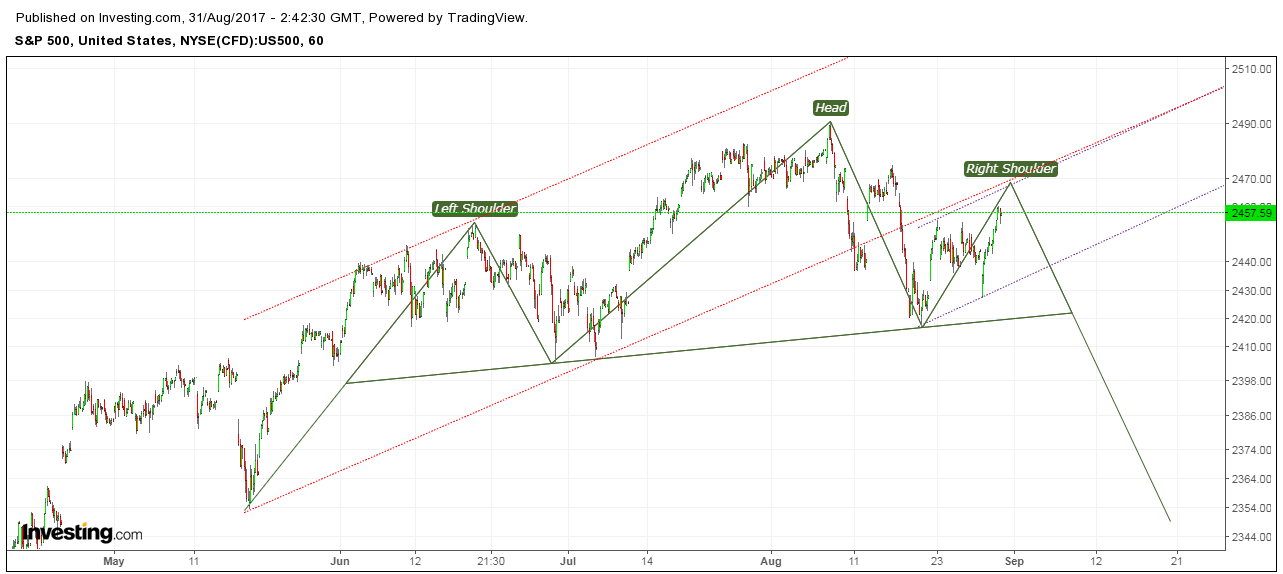
If we look at the intraday chart then it is bocoming more probable. The bounce from the low 2417 made on August 21, 2017 may face resistance near upward trend line of up sloping channel. Further, the red trend line also suggest a significant resistance near 2470. Apart from these levels, if it remains below 2475 then it will maintain the series of lower highs as well.
To conclude, I am reiterating my view point that if it remains below 2475 then it is highly probable that S&P 500 is making "Head and Should" pattern which is bearish sign for the market (at least for the short term).
Disclaimer: The purpose of this market-oriented publications is to outline the progress of markets to educate interested parties in the successful application of the technical analysis. While a course of conduct regarding investments can be formulated from such application of the analysis, at no time will author make specific recommendations for any specific person, and at no time may a reader, caller or viewer be justified in inferring that any such advice is intended. Investing carries risk of losses, and trading futures or options is especially risky because these instruments are highly leveraged, and traders can lose more than their initial margin funds. Information provided by author is expressed in good faith, but it is not guaranteed. The analysis never makes mistakes does not exist. Long-term success trading or investing in the markets demands recognition of the fact that error and uncertainty are part of any effort to assess future probabilities. Please ask your broker or your advisor to explain all risks to you before making any trading and investing decisions.


