We live in the moment. We have short attention spans (and shorter memories). For the most part, we want to know how stocks will perform over the next few weeks or months.
2026? 2027? Few “long-term” investors have the fortitude to regard today’s equity market decisions the way that a red wine vintner treats a Cabernet.
Nevertheless, Meb Faber, Chief Investment Office of Cambria Investment Management, recently posted an insightful piece on probable investment outcomes over long time frames. He looked at the three best rolling 10-year outcomes in U.S. stock history and he looked at the the three worst rolling 10-year periods.


The first thing that jumps out at you on the the three phenomenal 10-year periods are the sizable dividend yields and the modest stock market valuations (i.e., cyclically adjusted price-earnings ratio or “CAPE” or “PE10″) at the starting gate. 17.5%-20% annual appreciation? Remarkable.
In contrast, consider the three dismal 10-year returns that occurred in the 2nd chart above. The dividend yields at inception were far less inspiring, on average. And the valuations? The starting PE10 or CAPE for the three worst 10-year periods averaged in the high 20s. The consequence? Flat to 0% annual returns.
Meb Faber later simplified the story line as follows: Higher starting dividend yields coupled with lower starting valuations tend to produce enhanced 10-year outcomes. Meanwhile, lower starting dividend yields alongside higher starting valuations tend to offer abysmal 10-year results.
How might that matter here in late September of 2016? The chart below shows that U.S. stocks, at present, are far more similar to the average of the three worst 10-year sequences. A starting dividend yield of 2% combined with a CAPE of 26, then, may be detrimental for wealth-seekers going forward.

Naturally, an analysis along these lines excludes a wide variety of other factors that may or may not be pertinent in today’s world. Yet that hardly implies that investors should ignore expected probabilities.
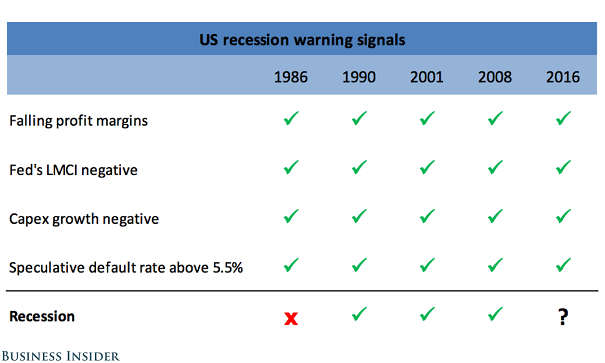
For instance, top equity strategists at Deutsche Bank (DE:DBKGn) recently published data demonstrating the heightened risk of a U.S. recession in the next 12 months. In fact, virtually all of the warning signs that preceded previous recessions are present today. What’s more, with the exception of 1986, the conditions in the chart below were associated with economic contraction.

Perhaps probability should not play a role in recession prognostication nor 10-year forecasts for stock assets. Or perhaps today’s world of ultra-low interest rates has rendered past comparisons worthless.
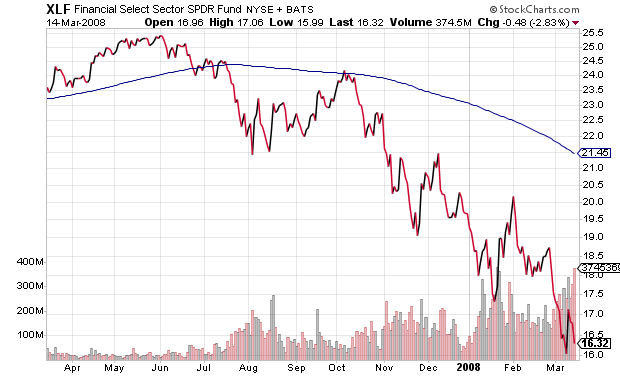
Then again, some comparisons are simply too remarkable to ignore. The U.S. financial crisis – when banks and other institutions had too much exposure to exceptionally bad debts – began well before the overall stock market paid attention. SPDR Select Financials (XLF) began a precipitous descent early in 2007, logging -35% between mid-March of 2007 and mid-March of 2008. Then Bear Stearns was bailed out by the Federal Reserve and its partner in J.P. Morgan Chase, giving a temporary reprieve to the beleaguered sector. It wasn’t until later in 2008, when the Fed refused to bail out Lehman Brothers, that the proverbial “caca” hit the fan.

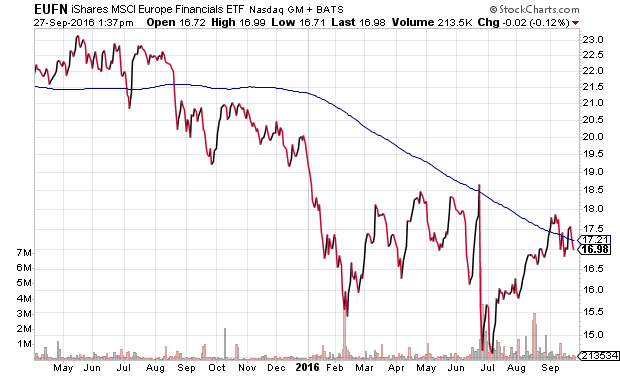
Why, then, should investors ignore the potentially devastating turn of events for European Financials over the last year-and-a-half? The iShares MSCI Europe Financials (NASDAQ:EUFN) had registered -35% between June of 2015 and June of 2016, before a recent bounce off the 2016 lows.

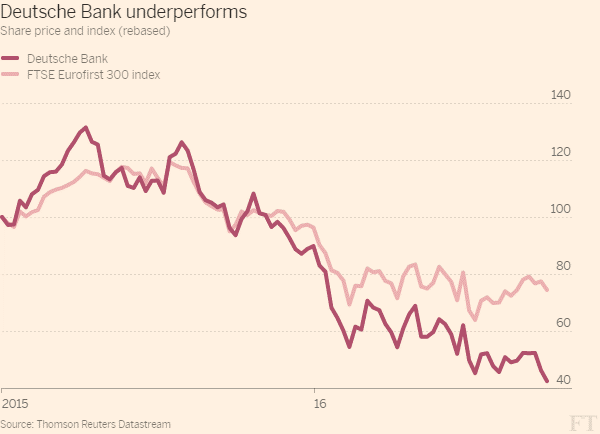
Still, would it be foolish to ignore the potentially devastating impact that an overseas financial crisis might have? Factor in the fact that Germany’s largest bank is down 70% from a high and recently logged an all-time low. Worse yet, the German government exclaims that it has no intention of “bailing out” the troubled institution.
If Deutsche Bank is indeed headed for bankruptcy, what influential financial abroad would be next? Could a hard-line approach against “too-big-too-fails” backfire, the way that it did when Lehman Brothers folded in 2008?

Speaking of probabilities, I imagine that Angela Merkel and the Germany government will bail out Deutsche Bank if necessary, regardless of how unpopular the move might be from a political standpoint. The Lehman lesson exerts a great deal of influence, as does the U.S. Federal Reserve and European Central Bank. (Ironically enough, the recession prognosticating stock strategists at Deutsche – the analysts who I mentioned above – would get to keep their jobs.)
Granted, there are a number of probabilities that may act as a tailwind for stocks (e.g., a victory for Hillary Clinton, ongoing central bank stimulus around the globe, the likelihood that “too big too fail” European banks would be bailed out, etc.). On the other hand, the headwinds are far more inclement. A wide variety of reliable stock valuation measures have reached extremes rarely seen outside of the technology bubble.
Corporate debt has doubled since the end of 2007. And economic weakness – from business sales/profit declines to anemic GDP growth to waning trade volume to disappearing capital expenditures to $20 trillion in federal debt to 2009-level corporate defaults to the evaporation of the middle class – stocks are unlikely to gain significant traction 7 1/2 years into the bull market.
Naturally, the probability of success can change quickly. A sizable correction would “probably” reset the potential for risk assets going forward. When will we get that bearish sell-off? What will be the catalyst? The possibilities for when and why are too numerous to count.
The probability that you would benefit by allocating a large amount (25%) to cash for a short period (0 months – 18 months), however, is exceptionally high. Like Meb Faber, I too look forward to better dividends and better starting valuations on U.S. stock indices, and having the cash on hand to pick up shares is essential.
Disclosure: Gary Gordon, MS, CFP is the president of Pacific Park Financial, Inc., a Registered Investment Adviser with the SEC. Gary Gordon, Pacific Park Financial, Inc, and/or its clients June hold positions in the ETFs, mutual funds, and/or any investment asset mentioned above. The commentary does not constitute individualized investment advice. The opinions offered herein are not personalized recommendations to buy, sell or hold securities. At times, issuers of exchange-traded products compensate Pacific Park Financial, Inc. or its subsidiaries for advertising at the ETF Expert web site. ETF Expert content is created independently of any advertising relationships.
