
Position management is one of the 3 required skills needed for covered call writing and put-selling. When share price gaps up or down there is a strong possibility that an exit strategy opportunity will present itself. There are times, however, when no action is the best action. On June 26th, 2017, Luis contacted me about Blackbaud Inc (NASDAQ:BLKB) when it gapped down from nearly $90.00 to $85.60. This tends to create a sense of urgency in us to act quickly to mitigate losses. It is important to stick to our game plan so that we make non-emotional decisions based on sound fundamental, technical and common-sense principles.
Price chart of BLKB showing the gap-down (sent from Luis)

What caused the gap-down?
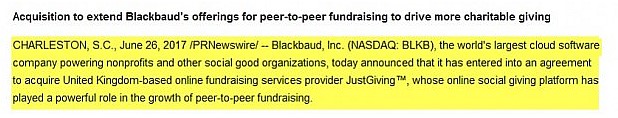
We first check the news to see the etiology of the price decline. In June 2017, tech stocks were volatile and declining after a meteoric rise the previous few months. The news events also showed an acquisition by BLKB which just happened to be made public on June 26th:
Price chart of the $90.00 call option
So far there appears to be no reason to panic and act immediately. Remember, we always have our 20%/10% guidelines to guide us when to buy back our call options. let’s look at a price chart of the 1-month $90.00 call option to see how it was impacted after the news announcement:

The yellow field depicts a slight decline in option value on the 26th despite the price decline. Knowledge of the option Greeks may offer an explanation. Delta is the amount an option value will decline based on every $1 of share price decline. But option value only dropped by about $0.05. A major factor is that when price declines significantly, the implied volatility rises and this will enhance the value of the option. This is analogous to our study of the S&P 500 which is inversely related to the CBOE Volatility Index. Based on this chart, the 20%/10% guidelines are not met.
Location in contract month
Another factor that dictates what, if any, action is required is the number of days remaining in the contract. After June 26th, there were still 19 trading days remaining until expiration of the July contracts leaving plenty of time for price recovery or appropriate use of our exit strategy arsenal.
Price movement by end of July 2017 contract

After the gap-down (blue line) the price fully recovered to $89.33 (red line) by the end of the July contracts. If the price continued to decline, the 20%/10% guidelines would have resulted in closing the short calls.
Discussion
When there is a price gap-down in share value we must act or take no action based on a non-emotional analysis. This includes:
- Checking the news regarding the reason for the gap-down
- Analysis of option value in relationship to our 20%/10% guidelines
- Days remaining until contract expiration
Having a structured approach to investing will allow us to make our decisions without being influenced by two of our most egregious enemies: fear and greed.
Market tone
US stocks moved up this week with the CBOE Volatility index closing up at 11.32. The Senate’s passage of the tax bill late Friday evening may give a boost to the stock market on Monday as it offers favorable financial implications for large corporations. It now goes to conference with the House before it can be signed by the president. This week’s economic news of importance:
- New home sales for October reported at 685,000, above expectations
- The Case-Shiller home price index for September increased by 6.2%
- Consumer confidence index for November was 129.5 above expectations
- GDP for the 3rd quarter reported at 3.3%, as expected
- Jobless claims for week ending 11/25 was 238,000 below expectations
- Consumer spending for October was +0.3% above expectations
- Core inflation was 0.2%, as expected
- ISM manufacturing index was 58.2, showing expansion
- Construction spending for October increased by 1.4%, above expectations
THE WEEK AHEAD
Mon Dec 4th
- Factory orders (Oct)
Tue Dec 5th
- Trade deficit
- Markit services PMI
- ISM non-manufacturing index
Wed Dec 6th
- ADP employment
- Productivity Q3
Thu Dec 7th
- Weekly jobless claims (12/2)
- Consumer credit
Fri Dec 8th
- Non-farm payroll
- Unemployment rate
- Consumer sentiment
For the week, the S&P 500 rose by 1.53% for a year-to-date return of 18.02%
Summary
IBD: Market in confirmed uptrend
GMI: 6/6- Buy signal since market close of August 31, 2017
BCI: My portfolio makeup remains in a neutral bias, selling an equal number of out-of-the-money and in-the-money calls.
WHAT THE BROAD MARKET INDICATORS (S&P 500 AND VIX) ARE TELLING US
The 6-month charts point to a neutral outlook. In the past six months, the S&P 500 was up 2% while the VIX (11.32) moved up by 11%.
Much success to all,