Prepare For A 30-Year Bull Market
Heading into 2017, Wall Street was excited by the prospect of a U.S. president who sympathized completely with business. His promised tax and healthcare reforms were widely cheered by investors in the wake of his election. Yet the Congress has so far failed to deliver on those promises and investors are no longer giving the Trump administration a free pass based on the assumption that tax breaks are on the way.
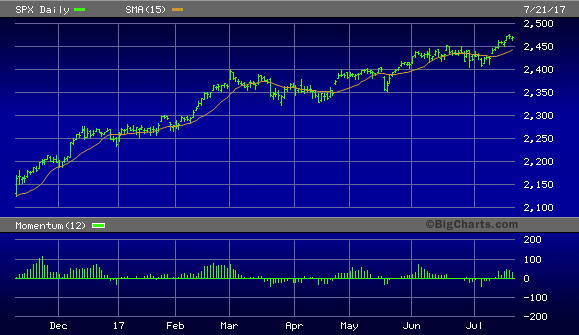
This loss of enthusiasm is reflected in the long periods of dullness the market has experienced since March. While the bull market leg which began with the November election remains intact, the market has proceeded in a halting fashion and has gradually lost some of its erstwhile momentum. The following graph illustrates this principle.

Along these lines, a number of Wall Street economists have expressed the belief that if Trump’s promised reforms fail to materialize, the stock market’s current valuation precludes a continuation of the bull market. There are a number of reasons why this statement is likely false, however, not the least of which is that the market doesn’t need a political excuse to rally. Indeed, if that were the case then China’s equity market, in view of the country’s Communist government, would forever be stuck in neutral. The pace of innovation and productivity in countries with a market-driven economy is consistently high enough to always provide some justification for higher valuations and stock prices, regardless of the political climate.
Writing nearly 200 years ago, Alexis de Tocqueville observed that in America no matter how much the tax burden increased, American ingenuity and resourcefulness always found a way to counteract its malignant effect. He stated:
“It is certain that despotism ruins individuals by preventing them from producing wealth, much more than by depriving them of the wealth they have produced; it dries up the source of riches, whilst it usually respects acquired property. Freedom, on the contrary, engenders far more benefits than it destroys; and the nations which are favored by free institutions invariably find that their resources increase even more rapidly than their taxes.” [Democracy in America]
Tocqueville understood that America is unique among the nations in that its people and commercial spirit are strong enough to countervail even the most strenuous attempts by politicians at slowing commercial progress. This principle is as true today as it was then, perhaps even more so.
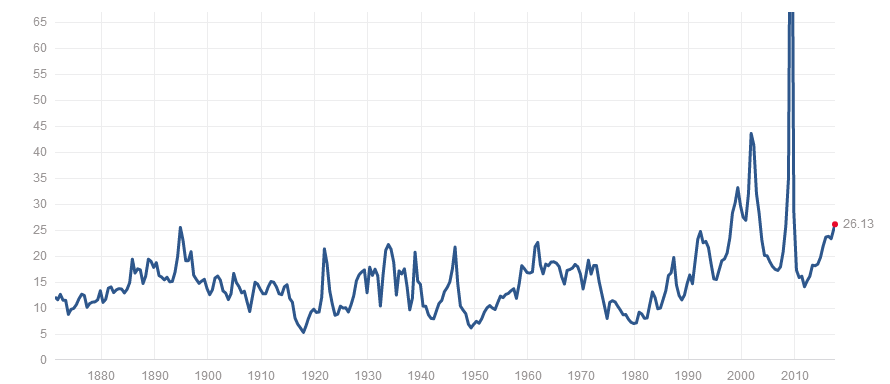
While many analysts are concerned by currently high market valuation indicators, the reality is that valuations can climb considerably higher before the market is in imminent danger of a bear market. The S&P 500 P/E ratio may be high at 26.13 by historical standards, it’s still a ways from those high levels in the late 1990’s/early 2000’s which preceded the death of the powerful ‘90’s bull market. Moreover, price/earnings alone isn’t a reliable measure of how undervalued or overvalued a market is. One must also take into account the investor sentiment backdrop, levels of participation among retail investors, and other technical and monetary policy factors when forming a final determination as to whether or not the market is truly “overvalued.”

To illustrate how important it is to consider investor sentiment along with valuation, I reprint here the words of William Jiler, who wrote investment books in the 1960s. Using International Business Machines (NYSE:IBM) as an example, he wrote:
“How could [an investor] anticipate that IBM would sell as low as 12 times its annual profit in the late Nineteen Forties and at 60 times earnings in the late Fifties? Obviously, ‘investor confidence’ went up sharply in the Fifties. And obviously, the psychology of the market – that is, the sum of the attitudes of all potential buyers and sellers – is a crucial factor for determining prices.” [How Charts Can Help You in the Stock Market]
The main consideration for stocks going forward is the level of participation among individual investors. With investor sentiment still neutral and few small investors actively trading, the bull market still has plenty of room to run. The informed investors who are keeping the bull market alive need someone to sell to when it finally comes time for them to unload their holdings. That someone is the uninformed public which by and large has been afraid of owning stocks since the 2008 credit crash. Until they rediscover the “joys of investing” the 8-year-old bull market will continue to age, all the while maintaining its vigor.
History teaches that following a major financial crisis, a bull market lasting from around 20 to 30 years normally follows. Such was the case following the Great Crash and Depression of the 1930s, the economic and political turmoil of the early 1970s, and in other eras in U.S. market history.
The last crisis in 2008-09 witnessed the birth of a new secular bull market which is already eight years old. A generation is around 20-30 years, which partly explains why bull market typically last so long until the next great crash; it takes that long for the generation that experienced the last crisis to be replaced by an entirely new one which doesn’t remember it. It’s only when the new generation has come of age that the mistakes which led to the previous crisis are repeated and the cycle begins anew.
Given that the current generation is still, nearly 10 years later, still averse to stocks to a large extent, the secular bull market has probably another 10-20 years to run before encountering the problems which always prove fatal to it. I’m referring of course to the dangers of over-participation and excess enthusiasm. Those dangers are nowhere in sight today. We can therefore assume that the long-term bull market still has many more years to run before eventually reaching its terminus.
Mastering Moving Averages
The moving average is one of the most versatile of all trading tools and should be a part of every investor’s arsenal. Far more than a simple trend line, it’s a dynamic momentum indicator as well as a means of identifying support and resistance across variable time frames. It can also be used in place of an overbought/oversold oscillator when used in relationship to the price of the stock or ETF you’re trading in.
