With 2015 being a pre-election year many traders and market commentators have all assumed this year will be a lock for the bulls. Historically pre-election years have been very strong, having not experienced a down year according to the Stock Trader’s Almanac (STA) in the last 75 years. The reason for excessive bullishness is often rooted in the belief that the sitting president will do all he can to bolster economic growth and consumer sentiment going into the following election. Since 1931, January has historically been one of the strongest months in a pre-election year, and so far in 2015 January is down nearly 2%. Is this a bad sign for things to come if January doesn’t pick up its performance?
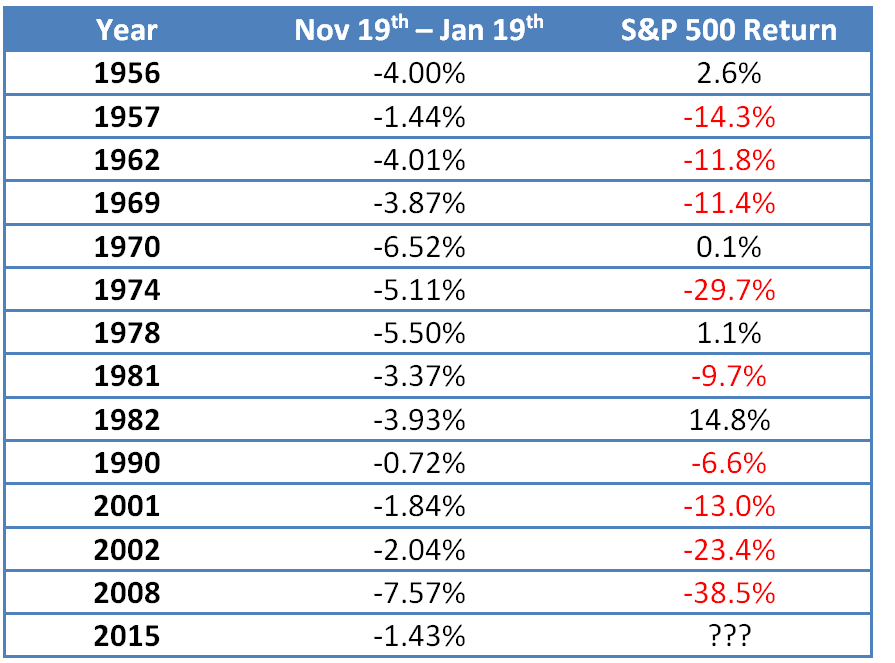
Last November I wrote a post “A Unique Seasonal Study to Forecast 2015 Returns.” In that post I highlighted the work done by Wayne Whaley who won the 2010 Charles Dow Award by the Market Technician Association. As we finish this period of time that Wayne designates as a good predictor of up and down years for the S&P 500, historical data doesn’t fare well for 2015.
Looking at the data by Whaley of years that have seen his specified time period go negative, which includes 13 years since 1950, only four were followed by positive returns for the S&P 500. Whaley also notes that ten of the twelve negative Nov.-Jan. periods saw at least a 12% drawdown during the year. However it’s important to note that none of these years were also pre-election years.

For 2015 we have a unique situation where the Nov.19th- Jan.19th period was negative but the first five trading days of January resulted in a positive return. According to the STA, over the last 41 years, 85.4% of the time the market has been positive when the first five trading days also produced a positive return. When we look at pre-election years using STA’s data, 12 of the last 16 followed the pattern (positive or negative) of the first five days of January, with a recent exclusion of 2011.
If we were to look for years where Whaley’s time period of Nov.-Jan. was negative and the first five days of January were positive, since 1950 there have been just three such years. Of those three years two were negative, 1990 and 2002.

What about the decennial cycle, in which we look at the returns of years ending in 1, 2, 3, 5, 6 and so on? Year 5, wherein 2015 would be included, has been quite strong – up 83% of the time with an average return of 21.5%!
Going into 2015 we have only had two instances of six or more straight positive years going all the way back to 1835, the last occurrence being ’91 to ‘99 during the dot-com bubble. If the bulls are able to pull it out and keep ’15 in the green then this will only be the third 6+ year streak in 180 years.
Confused yet? There’s a decent amount of contradicting data for how 2015 will play out and I suppose that’s not a bad thing, as it prevents the breeding of overconfidence. Nothing has a perfect record and anything that does will eventually have its first incorrect forecast at some point sooner or later.
Where will 2015 end? I have no idea, but I find myself leaning more towards Whaley’s research and would not be surprised if we saw just a low single digit if not a negative return for the year. With the analysis that I do for the firm I work for, I allow price action to lead my bias. We’ll see what price action does over the coming 11 months and if another notch gets added for Whaley’s study or if the pre-election and start of January hold true as being historically bullish.
Disclaimer: Do not construe anything written in this post or this blog in its entirety as a recommendation, research, or an offer to buy or sell any securities. Everything in this post is meant for educational and entertainment purposes only. I or my affiliates may hold positions in securities mentioned in the blog. Please see my Disclosure page for full disclaimer.
