“I take my hat off that you are able to continue picking up pennies in front of a steamroller. Reading your newsletter, I scratch my head in amazement at your ability to increase your exposures in a market you admit is the most expensive ever.” – @mlevin999
That was a comment I got on Twitter following a recent newsletter, where I discussed increasing our exposure concerning our short-term “buy signals.” To wit:
“The uptick in money flows did allow us to add some exposure to portfolios in holdings we had taken profits in with the previous ‘sell’ signal.”
I can understand the confusion when this past week I discussed the issue of “If everyone sees it, is it still a bubble?”
“My confidence is rising quite rapidly that this is, in fact, becoming the fourth ‘real McCoy’ bubble of my investment career. The great bubbles can go on a long time and inflict a lot of pain, but at least I think we know now that we’re in one.” – Jeremy Grantham
How do you square a long-term “bearish” outlook on future returns with a short-term “bullish” bias?
Fundamentals
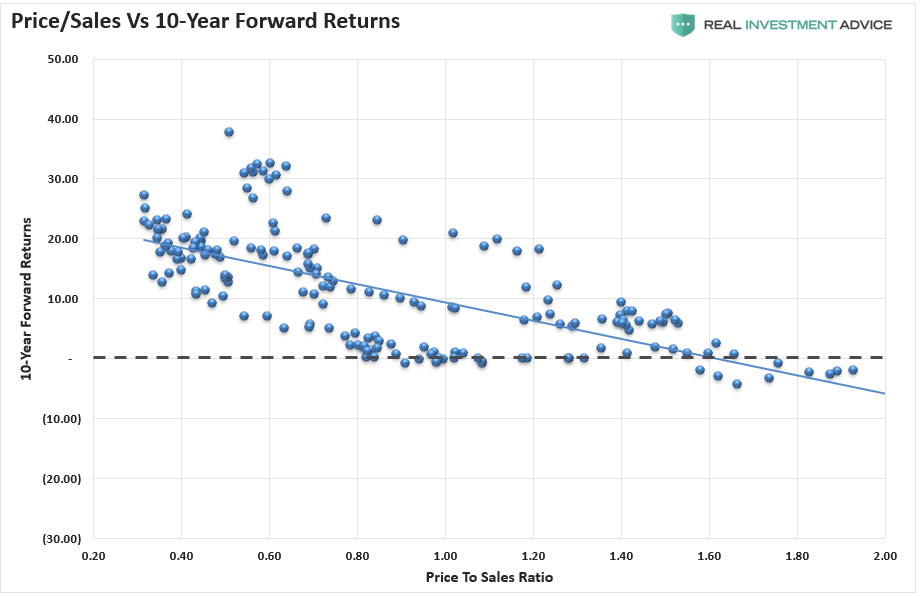
As discussed in “There Is No Way, This Doesn’t End Badly,” virtually every measure of fundamental analysis suggests the markets are very expensive.
“10-year forward returns are below zero historically when the price-to-sales ratio is at 2x. There has never been a previous period with the ratio climbing to near 3x.”
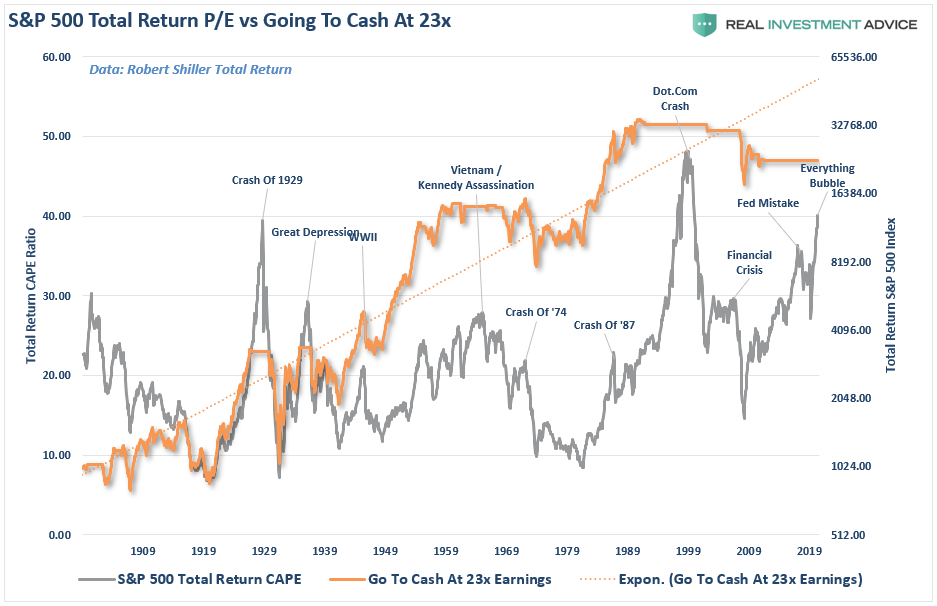
Whether it is Market Capitalization to GDP, CAPE, Tobin’s Q, or Price-to-Sales, the problem with all valuation measures is they are horrible market-timing indicators. As shown in the chart below, if you had gone to cash when the S&P first crossed into “expensive” territory greater than 23x CAPE, you would have missed most of the current bull market cycle.
Being doggedly attached to valuations and fundamentals can prove just as dangerous to long-term returns as getting caught in a bear market. While a bear market does indeed destroy capital, not participating in a bull market has an equal impact on ending results.
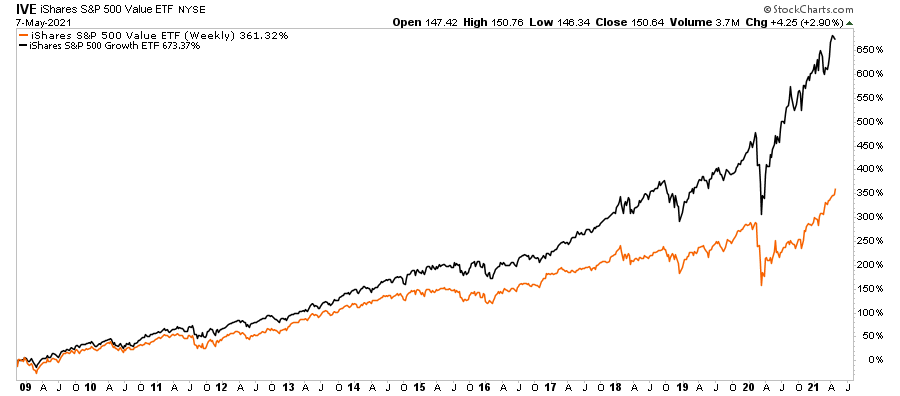
An excellent example of the problem, shown below, with purely using fundamentals to manage a portfolio is the performance chart between “momentum” and “value” since 2009.
Of course, this is the direct result of sustained ZIRP (Zero Interest Rate Policy) and successive rounds of monetary stimulus by the Federal Reserve.
So what other choice do you have?
Technicals
Such is where technical analysis can provide some assistance. However, we also have to make some important distinctions:
- Most individuals dismiss technical analysis as “voodoo” primarily due to a lack of understanding.
- Specifically, we are not discussing the use of technical analysis for short-term day-trading or “market timing,” which is being “all in or all out” of a position or market.
- Importantly, as opposed to mainstream commentary, technical analysis is not infallible. While there are times it fails, such does not mean it does not work. The goal of technical analysis is to improve the “odds” of success by understanding overall market psychology in the short term.
- As noted, in the short term, fundamental analysis has a near-zero correlation to performance outcomes. Therefore, a tool is needed to measure and control overall investment risk.
In our management process, we are long-term investors with a fundamental bias. As discussed in “Fully Invested Bears:”
“Our job is to participate in the markets with a bias toward capital preservation. As noted, the destruction of capital during market declines has the most significant impact on long-term portfolio performance.
From that view, as a portfolio manager, the idea of ‘fully invested bears’ defines the reality of the markets we live with today. Despite the understanding that the markets are overly bullish, extended, and valued, we must stay invested or suffer potential ‘career risk’ for underperformance.”
An Example Chart
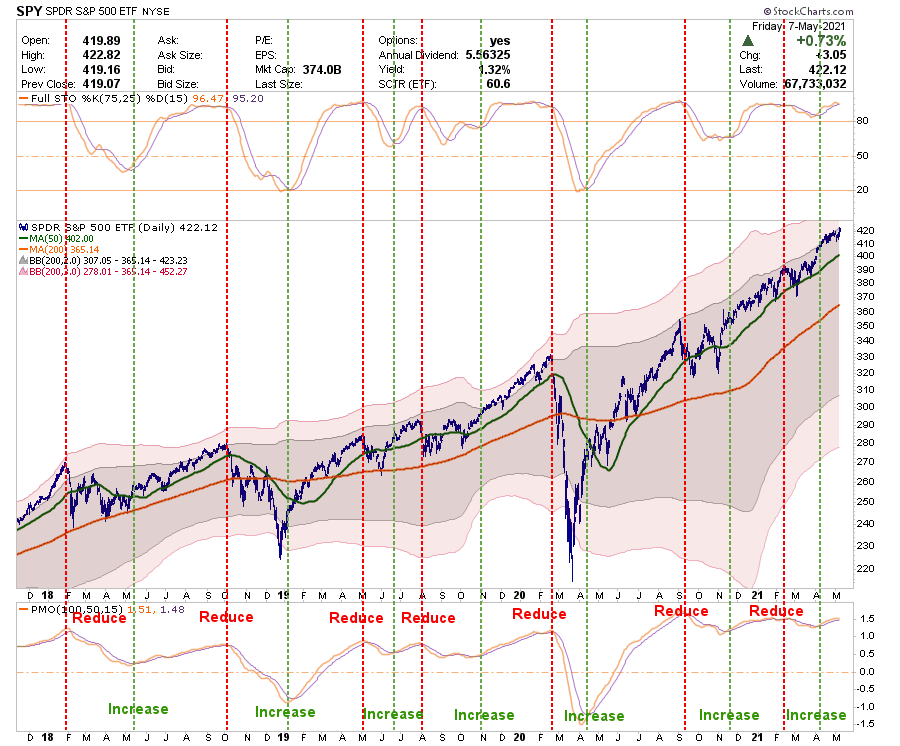
With this understanding, we use basic technical analysis to determine when the overall market risk exceeds potential returns in the short term. From that basis, we can adjust portfolio risk accordingly. The chart below is a simplified chart for example purposes only.
As shown, we are not talking about “going all to cash” during a “sell signal” but instead just reducing exposure, taking profits, and rebalance overall portfolio risk. When “buy signals” are triggered, it is just a process of reversing actions.
Are there times when we increase the size of the “risk” adjustments? Absolutely. A good example was in February 2020 as the market was pushing well into 3-standard deviations above the 50-dma (pink shaded areas), and a “reduce” signal got triggered. Such required a more significant reduction in “risk” as the market began a much deeper correction. As the correction ensued, we continued to reduce risk accordingly.
However, therein also exposes a problem with technical analysis. While price action, which is a reflection of market psychology, can undoubtedly help mitigate portfolio risk, technical analysis does not distinguish between a short-term pullback (0-10%), a correction (10%-20%), or a full-blown bear market (a reversal of the bullish trend.) Unfortunately, the magnitude does not get revealed until after it has started.
As such, it is essential to treat every signal with the same respect and act accordingly. For most investors, by the time they realize a correction is in process, it is too late for them to do anything about it.
A Delicate Balance
Managing money, either “professionally” or “individually,” is a complicated game in the long term. In the short term, particularly amid a speculative mania, it seems exceedingly easy. However, as is the case with every bull market, a strongly advancing market covers up the many investing mistakes investors make. It is the ensuing bear market that reveals them in the most brutal and unforgiving of outcomes.
The marriage of fundamentals and technicals is always a delicate balance. Fundamentals provide the basis for successful long-term returns but can lead to underperformance during momentum-driven markets. Technical analysis, likewise, has short-term benefits but can provide long-term challenges. Blending the two is like a “marriage of opposites.” Such can be highly successful, but it requires a lot of work.
Let me be very clear. You can not successfully “time the market.” Trying to be “all in or out” of every twist and turn of the market is impossible. However, that doesn’t mean you must be passive and let it all wash all over you.
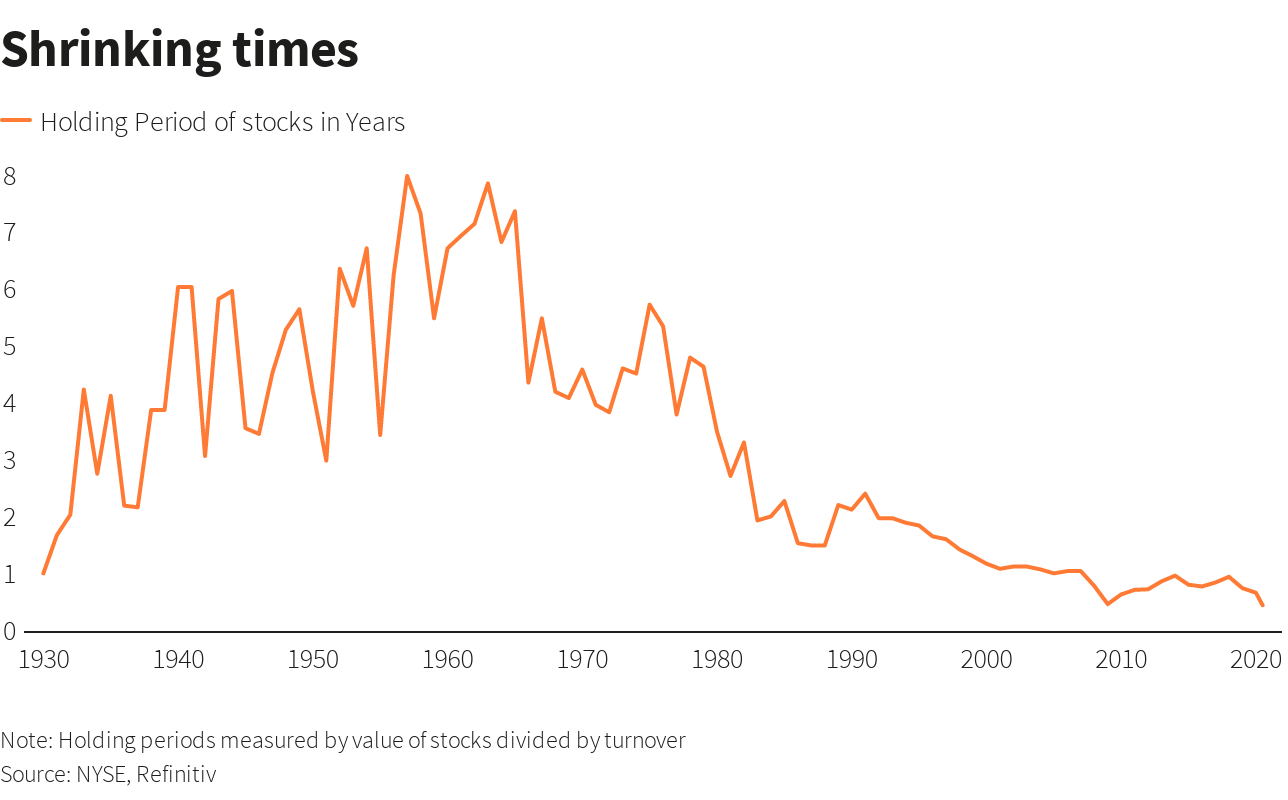
There is a clear advantage to providing risk management to portfolios over time. The problem is that most individuals cannot manage their own money because of “short-termism.” (As shown by shrinking holding periods)
Of course, with the media and Wall Street pushing the “you are missing it” mantra as the market rises, can you blame the average investor “panic” buying market tops and selling market bottoms?
Conclusion
Yes, given we are in a strongly trending bull market, driven by massive amounts of exuberance and liquidity, I am going to keep “picking up pennies in front of a steamroller.”
Such is why we overlay analysis to align expectations with reality. Implementing a solid investment discipline and applying risk management leads to the achievement of those expectations.
“Anyone who followed the numbers would have avoided the disaster of the 1929 crash, the 1970s or the past lost decade on Wall Street. Why didn’t more people do so? Doubtless, they all had their reasons. But I wonder how many stayed fully invested because their brokers told them ‘You can’t time the market.”‘ – Brett Arends
I do understand there is a significant risk. If Jack Bogle is correct, things could be very disappointing. Or, as Seth Klarman from Baupost Capital once stated:
“Can we say when it will end? No. Can we say that it will end? Yes. And when it ends and the trend reverses, here is what we can say for sure. Few will be ready. Few will be prepared.”
We saw much of the same mainstream analysis at the peak of the markets in 1999 and again in 2007. New valuation metrics, IPO’s of negligible companies, valuation dismissals as “this time was different,” and a building exuberance were common themes. Unfortunately, the outcomes were always the same.
Our goal is to prepared.
“History repeats itself all the time on Wall Street” – Edwin Lefevre
- English (UK)
- English (India)
- English (Canada)
- English (Australia)
- English (South Africa)
- English (Philippines)
- English (Nigeria)
- Deutsch
- Español (España)
- Español (México)
- Français
- Italiano
- Nederlands
- Português (Portugal)
- Polski
- Português (Brasil)
- Русский
- Türkçe
- العربية
- Ελληνικά
- Svenska
- Suomi
- עברית
- 日本語
- 한국어
- 简体中文
- 繁體中文
- Bahasa Indonesia
- Bahasa Melayu
- ไทย
- Tiếng Việt
- हिंदी
Picking Up Pennies In Front Of A Steamroller
Published 05/25/2021, 05:40 AM
Updated 02/15/2024, 03:10 AM
Picking Up Pennies In Front Of A Steamroller
Latest comments
Loading next article…
Install Our App
Risk Disclosure: Trading in financial instruments and/or cryptocurrencies involves high risks including the risk of losing some, or all, of your investment amount, and may not be suitable for all investors. Prices of cryptocurrencies are extremely volatile and may be affected by external factors such as financial, regulatory or political events. Trading on margin increases the financial risks.
Before deciding to trade in financial instrument or cryptocurrencies you should be fully informed of the risks and costs associated with trading the financial markets, carefully consider your investment objectives, level of experience, and risk appetite, and seek professional advice where needed.
Fusion Media would like to remind you that the data contained in this website is not necessarily real-time nor accurate. The data and prices on the website are not necessarily provided by any market or exchange, but may be provided by market makers, and so prices may not be accurate and may differ from the actual price at any given market, meaning prices are indicative and not appropriate for trading purposes. Fusion Media and any provider of the data contained in this website will not accept liability for any loss or damage as a result of your trading, or your reliance on the information contained within this website.
It is prohibited to use, store, reproduce, display, modify, transmit or distribute the data contained in this website without the explicit prior written permission of Fusion Media and/or the data provider. All intellectual property rights are reserved by the providers and/or the exchange providing the data contained in this website.
Fusion Media may be compensated by the advertisers that appear on the website, based on your interaction with the advertisements or advertisers.
© 2007-2025 - Fusion Media Limited. All Rights Reserved.

