There has been an explosion of ETF’s since the first, the SPDR S&P 500 (ARCA:SPY) Trust, came out over 22 years ago. Commodities that had been reserved for the futures market have them. Bond indexes have them. Every equity index you can imagine has at least 1. You name it, there is an ETF for it.
But not all ETF’s are created equal. It is important to know which is best to fit the needs of what you are looking for specifically for your portfolio. Liquidity is important. Fee structure too. And it needs to track the index or underlying that you are trying to mimic. But there is often more too it than that. Picking the right one can make the difference between an apple and a donut. A good case in point is in the country fund ETF’s.

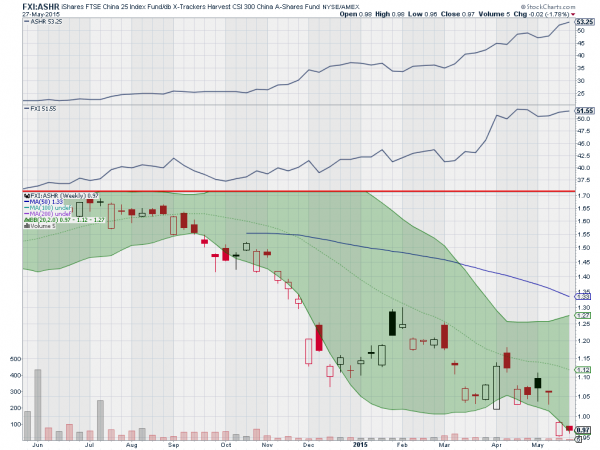
The chart above shows two ETF’s for the Chinese market. It can be split into two pieces by the red line. Above the red line are the price charts for the China A-Shares Fund (NYSE:ASHR) and the FTSE China 25 Index Fund (ARCA:FXI). Both look pretty good. They start to rise with the Chinese market and are at all-time highs. You might think from looking at them that they are both good proxies for the Chinese market. And they are. But there are some big differences that can be used to your advantage if you dig deeper.
In the lower panel is a ratio chart of the two ETF’s. If they both tracked the Chinese market with the same correlation, it would be moving sideways. But it is not. The A-Shares are clearly outperforming the FTSE Index. And this makes sense if you understand the macro scene in China. The FTSE 25 focuses on the large cap, mainly state owned or supported companies, not the broad market. It also covers stock that are focused on the Hong Kong Market. The A Shares ETF covers a much wider range of 300 stocks listed on local Chinese exchanges, specifically the Shenzen and Shanghai Exchanges.
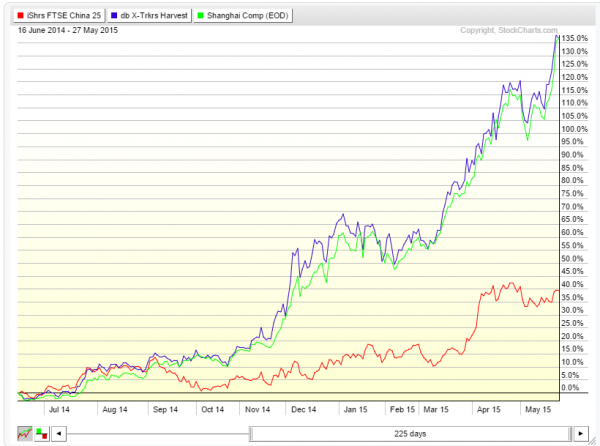
If you want broad exposure to local Chinese stocks, the A-Shares ETF is the way to go, not the FTSE 25 ETF. And with the macro picture in China one where locals are encouraged to buy stocks, rates are coming down, and stimulus is being provided - the broad market is the place to be. Think it has been close and does not matter that much? Look at the chart below.

The FTSE 25 ETF (red line) is up about 40% since the Shanghai Composite broke higher, and most of that over the last 3 months. But the A-Shares ETF (blue line) is up almost 140%. And the A-Shares nearly mirror the performance of the Shanghai Composite (green line). Make sure you do your research thoroughly when choosing a proxy for a market you cannot invest in directly. It can make a huge difference.
Disclaimer: The information in this blog post represents my own opinions and does not contain a recommendation for any particular security or investment. I or my affiliates may hold positions or other interests in securities mentioned in the Blog, please see my Disclaimer page for my full disclaimer.
