On Friday, it was announced that the U.S. added merely 75,000 jobs in May. Needless to say, a severe disappointment on the downside. The talk of an oncoming recession, and interest rate-cut speculations - were boosted. Is it justified? How close are we actually to the end of the business cycle? Should we buy gold now?
Payrolls Below Expectations, But We Are Not Surprised
The U.S. created just 75,000 jobs in May, following a strong rise of 224,000 in April (after a downward revision). The number surprised negatively, as the economists forecasted 180,000 created jobs. However, the weak payrolls confirmed what we saw in the ADP data earlier in week. As we wrote on Thursday edition of the Gold News Monitor, "ADP private-sector job growth tumbled to a 9-year low, which suggests that the Friday's official employment report from the Labor Department will be also disappointing." And this is indeed what happened.
Moreover, the weak headline number was accompanied by substantial downward revisions in April and March. Employment gains in those two months combined were 75,000 lower than previously reported. Consequently, job gains have averaged 151,000 per month over the last three months, which is lower than several months ago. Indeed, monthly job gains have averaged 164,000 in 2019, compared with an average gain of 223,000 per month in 2018.
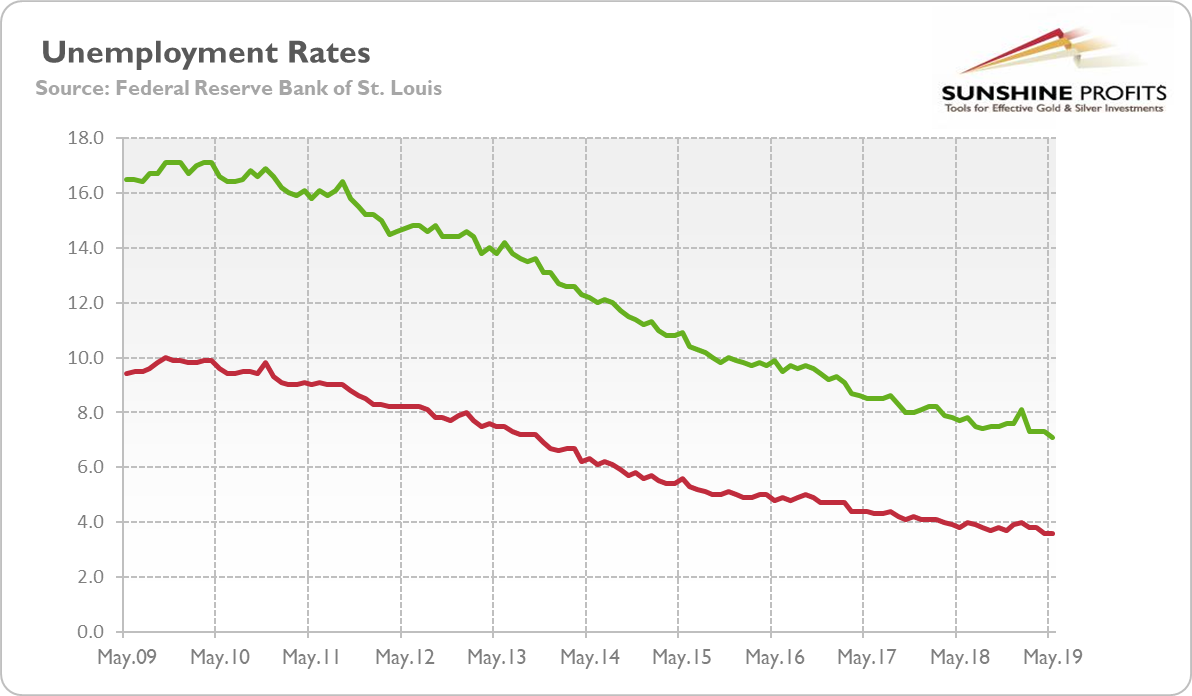
So, the pace of hiring has slowed, as the chart below shows. It is another worrisome signal of a slowing economy, especially that employment was weak everywhere except for three areas: professional and business services, education and health services, and leisure and hospitality. For example, construction companies hired just 4,000 new workers, while government and retailers cut jobs.
Chart 1: U.S. nonfarm payrolls (red bars, left axis, change in thousands of persons) and the annual growth in average earnings in the private sector (green line, right axis, %) from May 2014 to May 2019.
Unemployment Rate Stays Flat
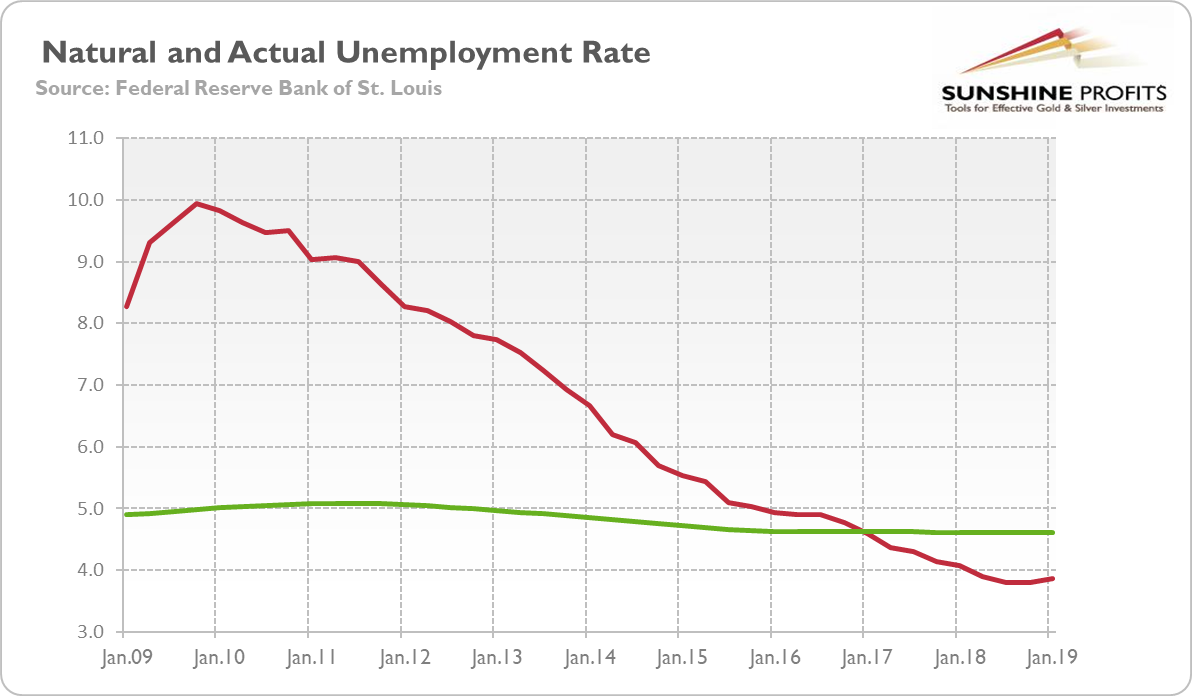
However, the employment situation report was not all bad. The unemployment rate stayed at a 49-year low of 3.6 percent. This is very important, as the unemployment rate is a powerful recession indicator, so if it had increased, we would have been very worried.
Actually, the unemployment rate decreased. We mean here U6, a broader measure of joblessness that includes part-time workers. As one can see in the chart below, that rate dropped from 7.3 to 7.1 percent, the lowest level since December 2000.
Payrolls, Tariffs And The Business Cycle: The Takeaway
While the U.S. isn't as international trade-dependent as other major economies, the tariffs are a drag and coupled with the fading fiscal stimulus, point to a slower growth in second half of 2019. This is clearly evident in the weakening export growth figures, which explains why manufacturing data are coming this weak. The jobs market remains relatively strong and projects a picture in line with what can be expected during a maturing business cycle expansion stage.
Chart 2: The unemployment rate U3 (red line) and the unemployment rate U6 (green line) from May 2009 to May 2019.

Implications For Gold
What does it all mean for the gold market? Well, the pace of hiring has slowed since the end of 2018, so it may put more pressure on the Fed to remain dovish and prolong its pause in the tightening cycle, which should support gold prices. Or, the U.S. central bank could even please the financial markets, and cut the federal funds rate, if we see another month of weak payrolls. This should be good news for the gold market, but investors should be aware that the interest rate outlook has been already priced in to a large extent.
On the other hand, the labor market remains healthier than a few years ago, with the unemployment rate staying at a multi-year low. May's disappointing jobs number could be just an outlier. Or it might result from a growing shortage of skilled labor in the very tight job market. As the latest Beige Book report shows, many companies complain that they cannot find workers. The low jobs numbers would then mean not a recession but the late stage of the boom phase of the business cycle.
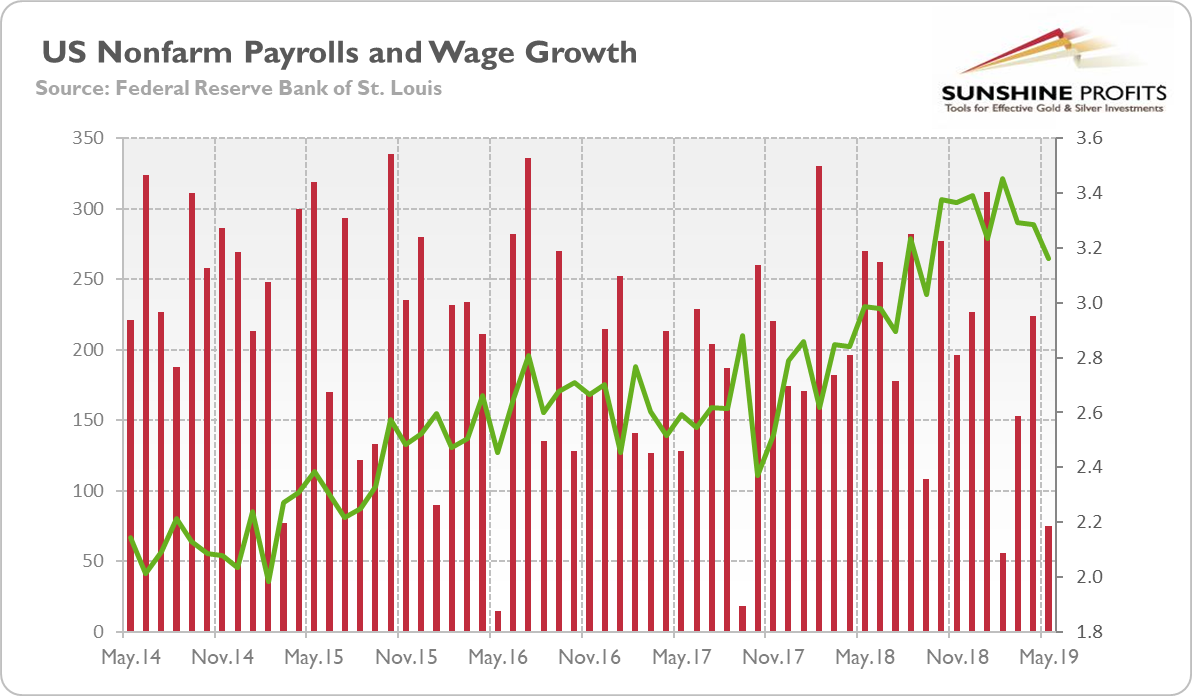
Indeed, as the chart below shows, the actual unemployment rate is currently below the so-called natural unemployment rate, which is the equilibrium rate for a given economy.
Chart 3: U.S. unemployment rate (red line, U3) and the natural unemployment rate (green line) from Q1 2009 to Q1 2019.

So is the rate a result of structural forces only? Hence, the current situation when the actual is below the natural rate, which may result from very favorable cyclical factors. We are still in the boom phase of the business cycle. Sorry, gold bulls.
Given the healthy labor market, the Fed should not cut interest rates. But the natural rate of unemployment is unobservable, so nobody knows what its true level actually is. The stock market increased after the disappointing payrolls, anticipating the dovish Fed's reaction. Gold prices have also increased, however, the gains were temporary. And the precious metals investors should not forget that when almost all market participants have bullish expectations, there is a risk of an opposite market outcome.

