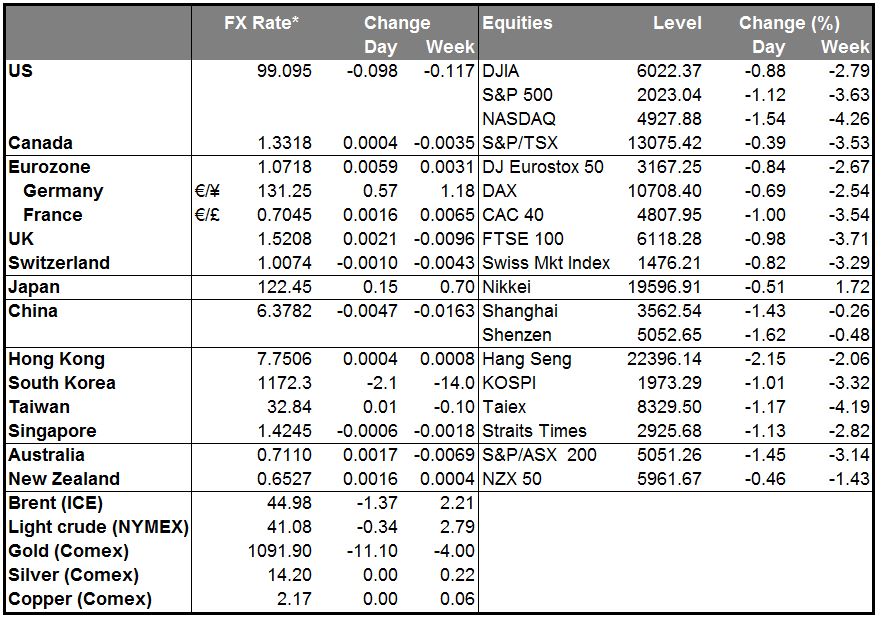
• Paris deadly attacks cause risk-off environment. In the wake of Paris terror attacks demand for the safe-haven, JPY and to a lesser extend CHF, firmed. Even though it’s been a relatively modest reaction, it could intensify if global risk rise. France already launched airstrikes against Islamic State in Syria, and world leaders promised a forceful response against terrorist attacks at the G20 meeting in Turkey. The tragic events in Paris could put investors in defensive mood as far as risk is considered, with equity markets poised to a weak start. Concern about similar attacks beyond France may have a more prolonged impact on travel and tourism sectors if the consumers’ sentiment deteriorates.
• Overnight, Japan’s economy fell back into recession in Q3, mainly due to the slowdown in EM economies. The preliminary GDP data showed a contraction of 0.2% qoq, followed by a 0.3% qoq contraction in Q2. The two consecutive quarters of contraction is the definition of a technical recession. This is the fifth time in seven years Japan slides into recession, putting policy makers under pressure to deploy further monetary or fiscal stimulus in the coming months. However, comments by BoJ Governor Kuroda so far showed that the Bank is in no mood to ease policy further any time soon. As a result, the market will closely watch the Bank of Japan meeting on Thursday for clues of a possible change in stance and hints of additional measures. The Nikkei dipped sharply at the opening of trade on Monday in the wake of Paris tragedy and declined even more following the soft data. As such, JPY found buying interest and strengthened against EUR and USD.
• Today’s highlights: During the European day, we get Eurozone’s final CPI for the October. As usual, Eurozone’s final inflation figure is expected to confirm the preliminary reading. Thus the market reaction is usually limited at the release, unless we have a huge revision. Norway’s trade balance for the same month is also coming out.
• In the US, the NY manufacturing PMI for November is coming out and from Canada we get manufacturing sales for September. The NY manufacturing index is forecast to have risen to -5.0 from -11.4, but to remain below zero, while there is no forecast for Canada’s manufacturing sales.
• We have only one speaker on Monday’s agenda. ECB President Mario Draghi speaks to the annual gathering for the Euro Finance Week in Frankfurt.
• As for the rest of the week, on Tuesday, the German ZEW survey for November is coming out. The current situation index is expected to see a modest decline, while the expectations index is expected to have risen. Last month, the expectations index plunged as the Volkswagen (DE:VOWG) scandal coupled with the weak growth in EM deteriorated the economic outlook for Germany. Therefore, a rebound in expectations seems normal after such a plunge.
• In the UK, the spotlight will be on the CPI data for October. In its quarterly inflation Report, the BoE downgraded its medium-term growth and inflation forecasts, while it noted that it sees risks slightly to the downside for inflation to reach their target in two years. As a result, a disappointment in the CPI data is possible, something that could push further back expectations of a rate hike by the BoE, and is likely to put the pound under renewed selling pressure.
• We get CPI data for October from the US as well. Following the astonishing surge in the NFP for October, even a modest rise in the US inflation rate is likely add to expectations for a Fed lift-off in December, and could strengthen the greenback further.
• On Wednesday, the US housing starts and the more forward-looking building permits for October are expected to have accelerated somewhat. These data are likely to confirm the overall strength in the housing sector and could support the dollar.
• On Thursday, during the Asian day, the Bank of Japan monetary policy meeting will take center stage. At their last meeting, the Bank kept its monetary stimulus program unchanged despite downgrading again its inflation forecast. At the press conference following the meeting, Gov. Kuroda maintained his optimistic view that the tight job market will push up wages and thus consumer spending, and that this would be sufficient to boost inflation. As such, we would expect the policy to remain unchanged again and the focus to shift on Gov. Kuroda press conference afterwards.
• The ECB releases the minutes of its October policy meeting when President Draghi signaled that the Bank stand ready to undertake further stimulus measures that could even include a cut to the already negative deposit rate. The minutes will give us more insights about the members’ discussion over which tools can be used and in what extent, to support Eurozone’s fragile economy.
• As for the indicators, we get the UK retail sales for October.
• Finally on Friday, Canada’s CPI data for October are coming out. Given the renewed slump in oil prices, a disappointment in the CPI figures is likely to put CAD under renewed selling pressure.
The Market
EUR/USD trades lower after Paris attacks
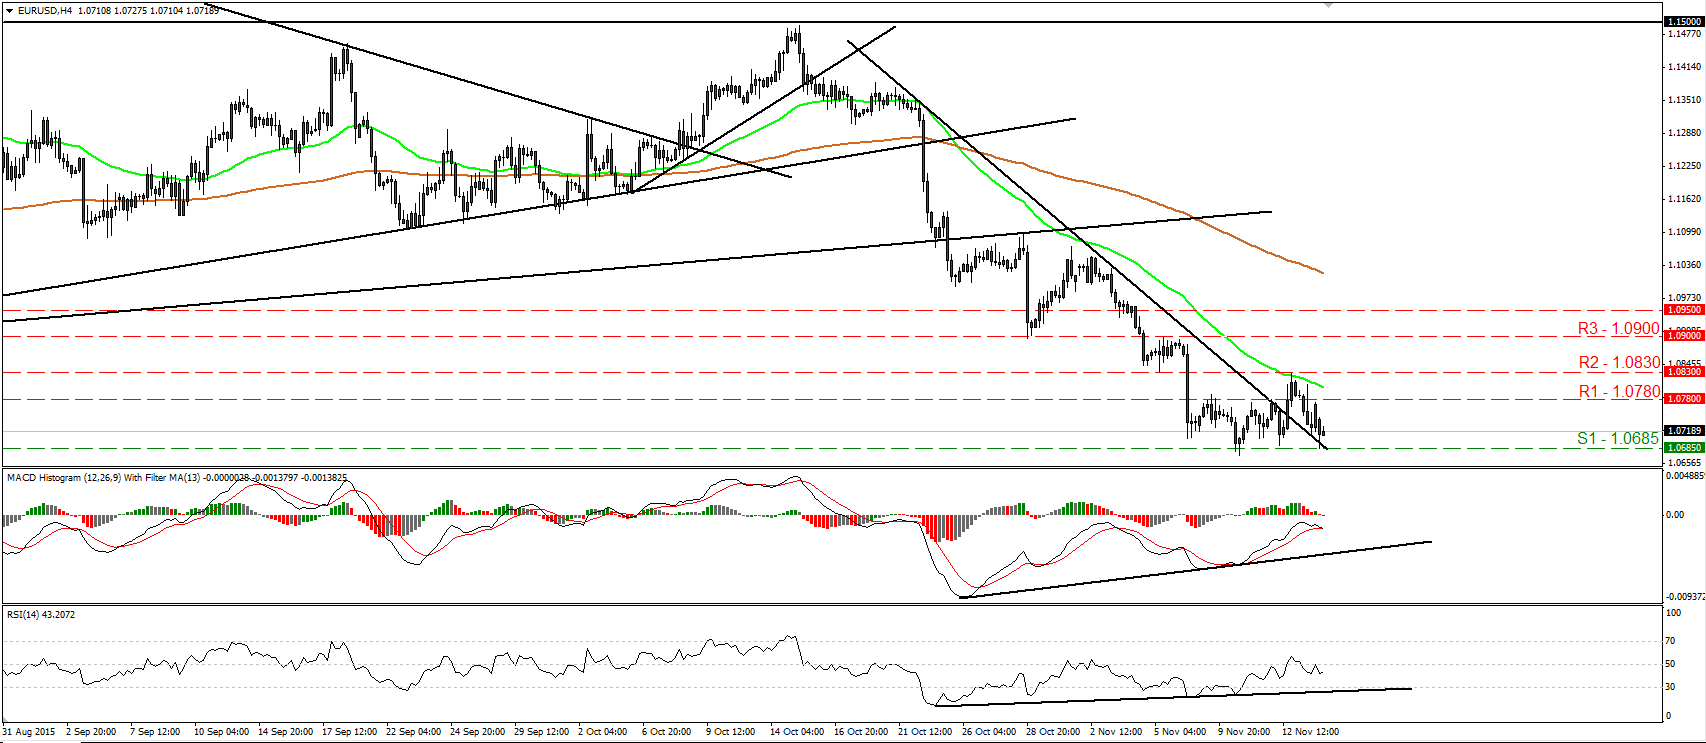
• EUR/USD gapped down on Monday after the deadly attacks in Paris. Nevertheless, the pair hit support at 1.0685 (S1) and then it rebounded somewhat. I still believe that the pair is poised to trade lower in the near term and as a result, I would expect a clear break below 1.0685 (S1) to open the way for our next support barrier of 1.0625 (S2), defined by the low of the 16th of April. Our short-term oscillators reveal negative momentum and corroborate my view. The RSI fell back below its 50 line, while the MACD, already negative, has topped and just fell below its trigger line. In the bigger picture, as long as the pair is trading below 1.0800, the lower bound of the range it had been trading since the last days of April, I would consider that the longer-term outlook has turned negative and that EUR/USD could continue trading south in the foreseeable future.
• Support: 1.0685 (S1), 1.0625 (S2), 1.0600 (S3)
• Resistance: 1.0780 (R1), 1.0830 (R2), 1.0900 (R3)
EUR/GBP hits support at 0.7020
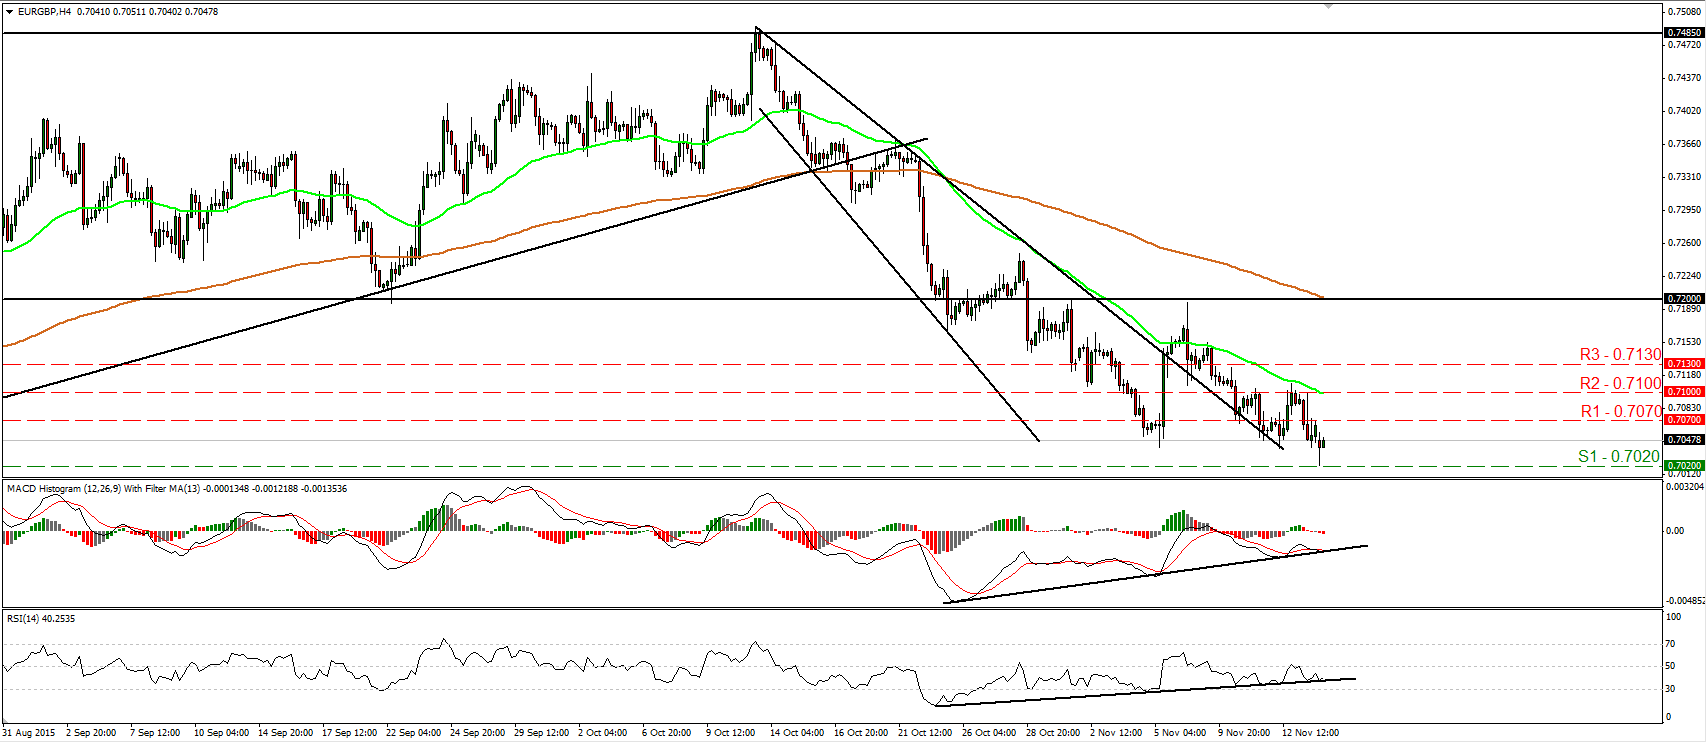
• EUR/GBP traded lower on Friday and today during the Asian morning, it hit support at 0.7020 (S1). Then, the rate rebounded somewhat. In my view, the short-term outlook remains negative and thus, I would expect a move below 0.7020 (S1) to challenge the psychological zone of 0.7000 (S2). Nevertheless, a break below 0.7000 (S2) is the move that would make me trust more that down path. Taking a look at our momentum studies, I see that the RSI rebounded from its upside support line, while the MACD, although negative, is testing its own support line. What is more, there is still positive divergence between both the indicators and the price action. These momentum signs enhance my view to wait for a move below 0.7000 (S2), before getting more confident on the downside. Switching to the daily chart, I see that the dip below the 0.7200 hurdle on the 28th of October has confirmed the negative divergence between the daily oscillators and the price action, and has also turned the longer-term outlook back negative. This increases the possibilities for EUR/GBP to continue trading lower in the not-too-distant future.
• Support: 0.7020 (S1), 0.7000 (S2), 0.6970 (S3)
• Resistance: 0.7070 (R1), 0.7100 (R2), 0.7130 (R3)
USD/JPY gaps down after Paris attacks
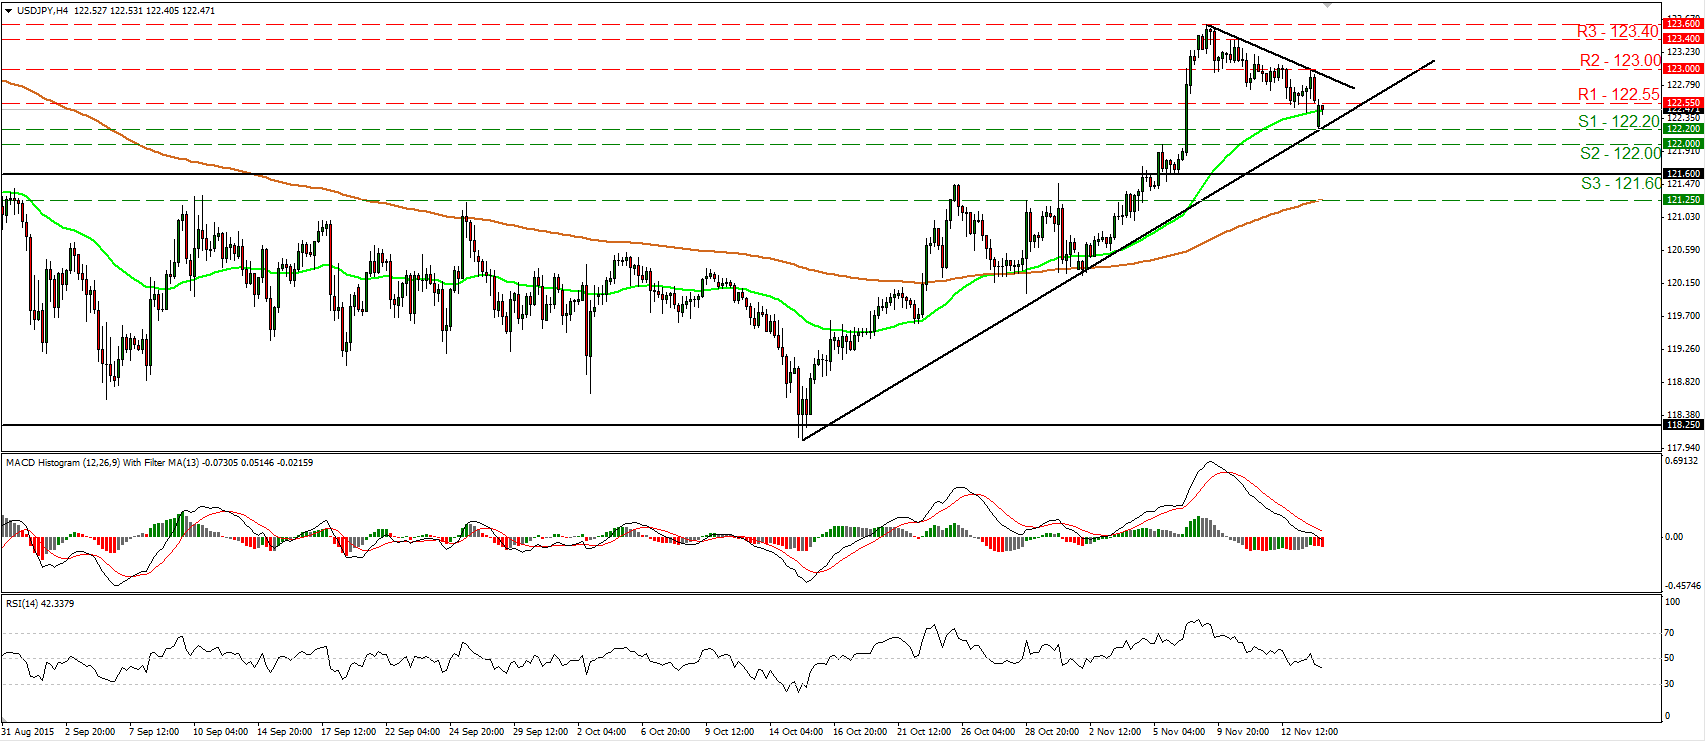
• USD/JPY opened the day with a gap down following the attacks in Paris. However, the pair hit support at the uptrend line taken from the low of the 15th of October and then it rebounded somewhat. Although the rate is trading above that uptrend line, I see risks that it could fall below that line soon. Our short-term oscillators indicate negative momentum and corroborate my view. The RSI fell below its 50 line and points south, while the MACD, already below its trigger line, has just turned negative. A break below the 122.00 (S2) line is the move that could carry more bearish extensions and it is possible to open the way for the 121.60 (S3) obstacle. On the upside, I prefer to see a break above the 123.00 (R2) area before assuming that the prevailing uptrend is back in force. As for the broader trend, the break above 121.60 (S3) signaled the upside exit of the sideways range the pair had been trading since the last days of August and turned the longer-term picture back positive. As a result, I would treat the setback started on the 9th of October, or any extensions of it, as a corrective phase for now.
• Support: 122.20 (S1), 122.00 (S2), 121.60 (S3)
• Resistance: 122.55 (R1), 123.00 (R2), 123.40 (R3)
Gold surges in a safe haven reaction
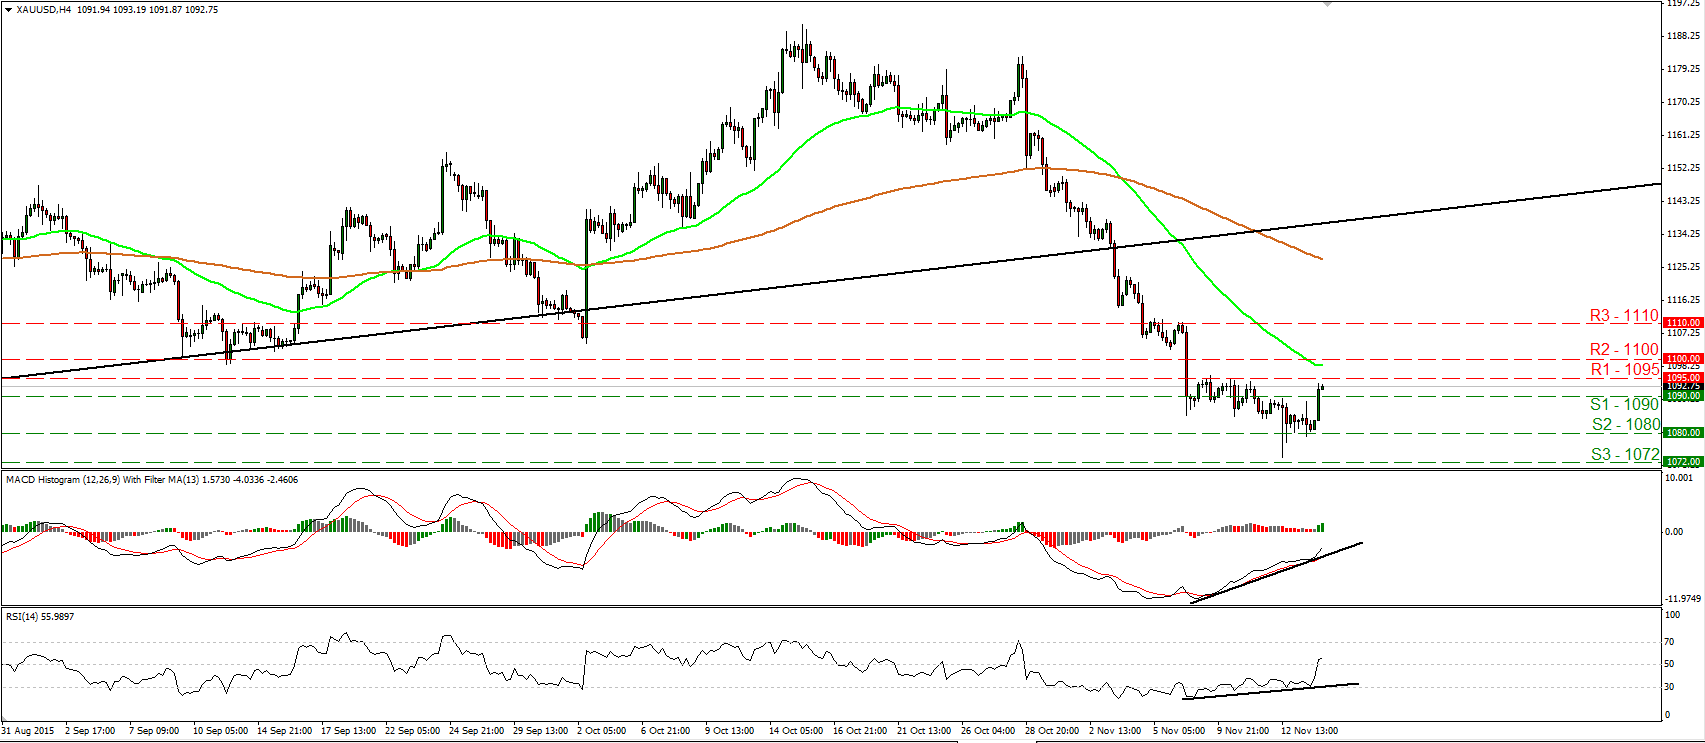
• Gold rallied during the Asian morning Monday, in a safe haven reaction following the deadly attacks in Paris. The metal rebounded from the support zone of 1080 (S2) and managed to overcome the 1090 (S1) hurdle. It now looks to be headed for a test near 1095 (R1), where a break is likely to challenge the psychological zone of 1100 (R2). Shifting my attention to our momentum studies, I see that the RSI edged higher and emerged above its 50 line, while the MACD, although negative, stands above its trigger line and points north. There is also positive divergence between these indicators and the price action. These signs give ample evidence that the yellow metal is likely to continue higher for a while. Nevertheless, taking a look on the daily chart, the plunge below the upside support line taken from the low of the 20th of July has shifted the medium-term outlook to the downside, in my view. As a result, I would treat the current rebound or any extensions of it as corrective phase before the bears decide to shoot again.
• Support: 1090 (S1), 1080 (S2), 1072 (S3)
• Resistance: 1095 (R1), 1100 (R2), 1110 (R3)
WTI continues lower
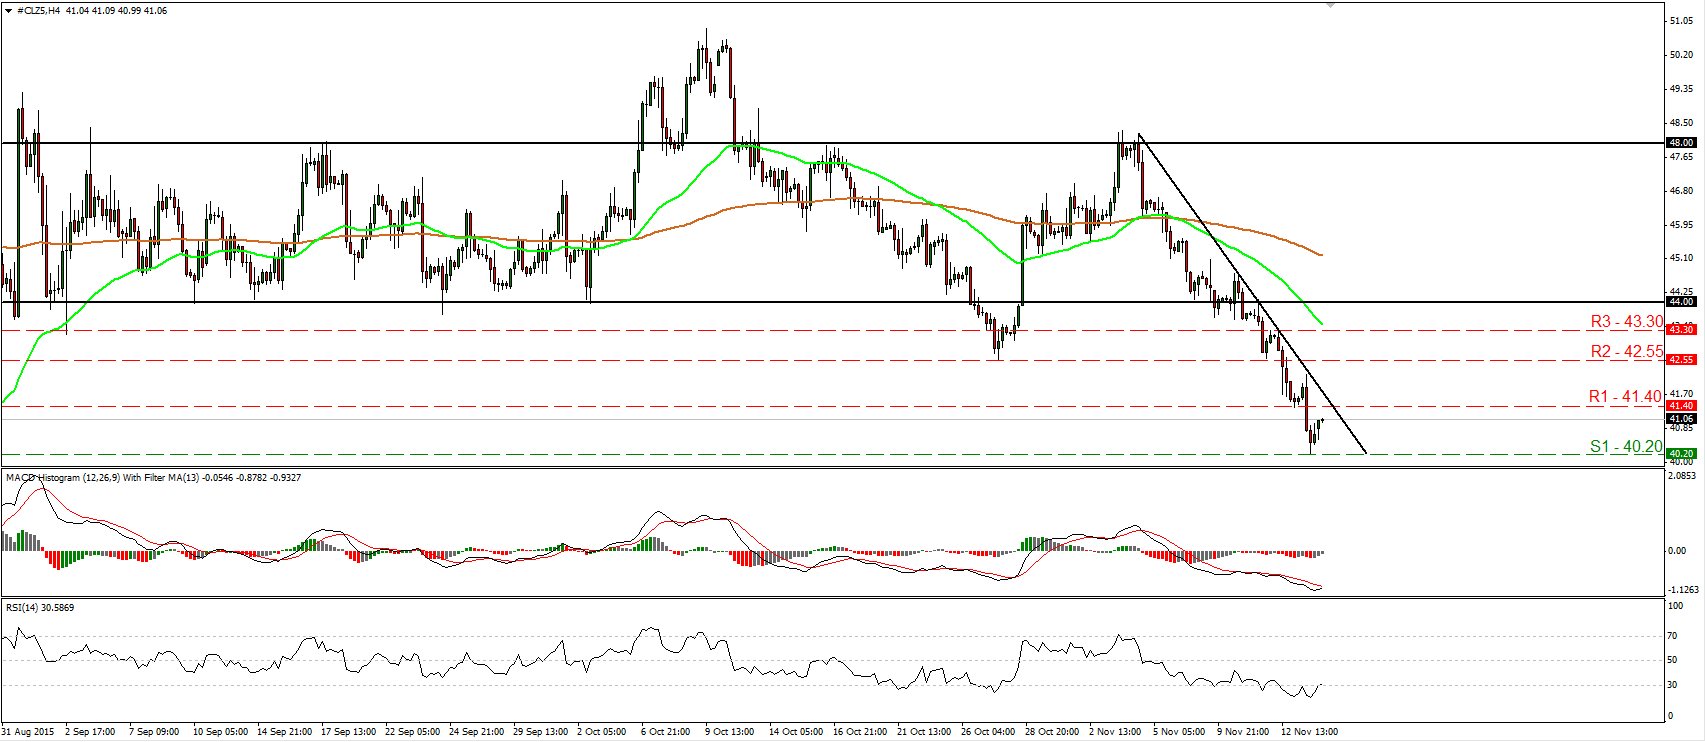
• WTI continued trading south on Friday, but the decline was halted at 40.20 (S1). Subsequently, the price rebounded. As long as the price structure remains lower peaks and lower troughs below the short-term downtrend line taken from the peak of the 4th of November, the short-term trend remains negative. However, I prefer to see a clear close below the psychological zone of 40.00 (S2) before I get more confident on further declines. For now, I see the possibility that the current rebound may continue for a while, perhaps even above the aforementioned downtrend line. A break above 41.40 (R1) is likely to confirm the case and could set the stage for extensions towards the 42.55 (R2) area. Our short-term oscillators support the notion as well. The RSI has bottomed within its oversold territory and just crossed above its 30 line, while the MACD, although negative, has bottomed and could move above its trigger line. On the daily chart, the dip below 42.55 (R2) confirmed a forthcoming lower low and turned the longer-term outlook back to the downside.
• Support: 40.20 (S1), 40.00 (S2), 39.00 (S3)
• Resistance: 41.40 (R1), 42.55 (R2), 43.30 (R3)

