
Papa John’s International, Inc. (NASDAQ:PZZA) posted better-than-expected results in third-quarter 2017.
However, the company’s shares have lost 1.8% in after-hour trading on Oct 31.
Earnings and Revenue Discussion
Adjusted earnings of 60 cents per share beat the Zacks Consensus Estimate of 59 cents by 1.7%. Moreover, earnings increased 5.3% year over year on higher revenues and lower general and administrative (G&A) costs.
Revenues of $431.7 million also surpassed the consensus mark of $426.7 million by 1.2% and improved 2.2% from the year-ago quarter. The upside in revenues was favored by higher North America commissary sales from increased volumes.
Papa John's International, Inc. Price, Consensus and EPS Surprise
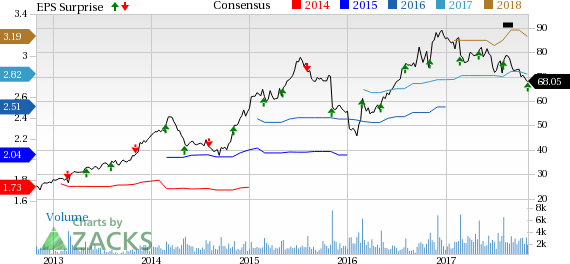
Papa John's International, Inc. Price, Consensus and EPS Surprise | Papa John's International, Inc. Quote
Behind the Headline Numbers
Global restaurant sales growth of 4.4% in the third quarter was higher than the last quarter’s rise of 4.1% but lower than the year-ago quarter’s 7.6%.
Excluding foreign currency impact, global restaurant sales growth was 5%, lower than the prior quarter and the year-ago growth of 5.1% and 8.9%, respectively.
Domestic company-owned restaurant sales were down 1.4% year over year in spite of a 1.7% increase in comparable sales.
North America franchise royalties and fees were up 3.2%, driven by a 0.7% rise in comparable sales. North America commissary and other sales rose 4.9% on higher volumes.
Comps at system-wide North American restaurants were up 1%, lower than 5.5% comps growth in the year-ago quarter and 1.4% in the last quarter.
International revenues were up 9.9% year over year primarily on positive comparable sales. Comps at system-wide international restaurants increased 5.3%, lower than comps growth of 7.6% a year ago but higher than 3.9% in the preceding quarter.
G&A costs decreased 1% year over year in the quarter. This is primarily due to lower management incentive costs coupled with benefits from higher revenues.
2017 Outlook
For 2017, Papa John’s expects adjusted earnings per share growth of 3% to 7%, below the previous range of 8% to 12%.
North America system-wide comps growth is projected as positive, up to 1.5%, down from the previous range of 2% to 4% growth.
Meanwhile, international comps are still expected to grow 4% to 6% in 2017.
Debt-EBITDA ratio is expected in the range of 2.5 to 3.5, higher than the previously projected range of 1.5x to 2.0x.
Capital expenditures are expected between $45 million and $55 million, same as the previously guided range.
The company reaffirmed its guidance for net global new unit growth at the range of 3-4%, primarily to mirror the closure of stores in India.
In fourth-quarter 2017, the company plans to carry out an accelerated share repurchase program for a portion of the share buyback authorization.
Zacks Rank & Peer Releases
Papa John’s has a Zacks Rank #3 (Hold). You can see the complete list of today’s Zacks #1 (Strong Buy) Rank stocks here.
McDonald's Corp. (NYSE:MCD) reported third-quarter adjusted earnings per share of $1.76, beating the Zacks Consensus Estimate of $1.75 by 0.6%. Earnings also increased 9% year over year.
Chipotle Mexican Grill, Inc.’s (NYSE:CMG) third-quarter 2017 adjusted earnings of $1.33 per share lagged the Zacks Consensus Estimate of $1.56 by 14.7%. However, the figure increased significantly from the prior-year quarter earnings of 79 cents.
Domino's Pizza, Inc.’s (NYSE:DPZ) third-quarter 2017 adjusted earnings of $1.27 per share outpaced the Zacks Consensus Estimate of $1.12 by 4.1%. Further, the bottom line surged 32.3% year over year on the back of higher revenues and lower share count.
More Stock News: This Is Bigger than the iPhone!
It could become the mother of all technological revolutions. Apple (NASDAQ:AAPL) sold a mere 1 billion iPhones in 10 years but a new breakthrough is expected to generate more than 27 billion devices in just 3 years, creating a $1.7 trillion market.
Zacks has just released a Special Report that spotlights this fast-emerging phenomenon and 6 tickers for taking advantage of it. If you don't buy now, you may kick yourself in 2020.
Click here for the 6 trades >>
Chipotle Mexican Grill, Inc. (CMG): Free Stock Analysis Report
Domino's Pizza Inc (DPZ): Free Stock Analysis Report
McDonald's Corporation (MCD): Free Stock Analysis Report
Papa John's International, Inc. (PZZA): Free Stock Analysis Report
Original post
Zacks Investment Research