That title pretty much sizes up where we are in transiting to the new year. As was the case in 2013 and 2014, Gold throughout 2015 continued to be outed, disparaged and impugned; we now see 2016 as the year the general equities markets get screwed. This new dawn shall remind us that the stock market is hardly a savings account, and with a little luck, Gold might just gain back that which it richly deserves, (thank you Aretha): ![]() "R-E-S-P-E-C-T"
"R-E-S-P-E-C-T"![]() . Find out what it means to me as we're to be interviewed next Saturday, 09 January on Toronto's 50,000-watt flamethrower, Talk Radio AM640 in the 1:00pm EST hour. Check your local Internet listings and click on the word "Listen". Out with the old (S&P 500) and in with the new (Gold). Sounds good to me.
. Find out what it means to me as we're to be interviewed next Saturday, 09 January on Toronto's 50,000-watt flamethrower, Talk Radio AM640 in the 1:00pm EST hour. Check your local Internet listings and click on the word "Listen". Out with the old (S&P 500) and in with the new (Gold). Sounds good to me.
"Look" meanwhile is the operative word as we go to 2015's carnage in displaying the BEGOS Markets Standings and comparing them with the Dollar Index -- which despite increasing in M2 supply by 6.3% (from $11.66 trillion to $12.39 trillion) -- nonetheless managed to increase in value by 9.0% (from 90.640 to 98.760), a perception sufficiently warped to warrant The Buck as the eighth wonder of the world: the more there are, the more they're worth. Might as well take your Economics 101 textbook and toss it. Worthless!
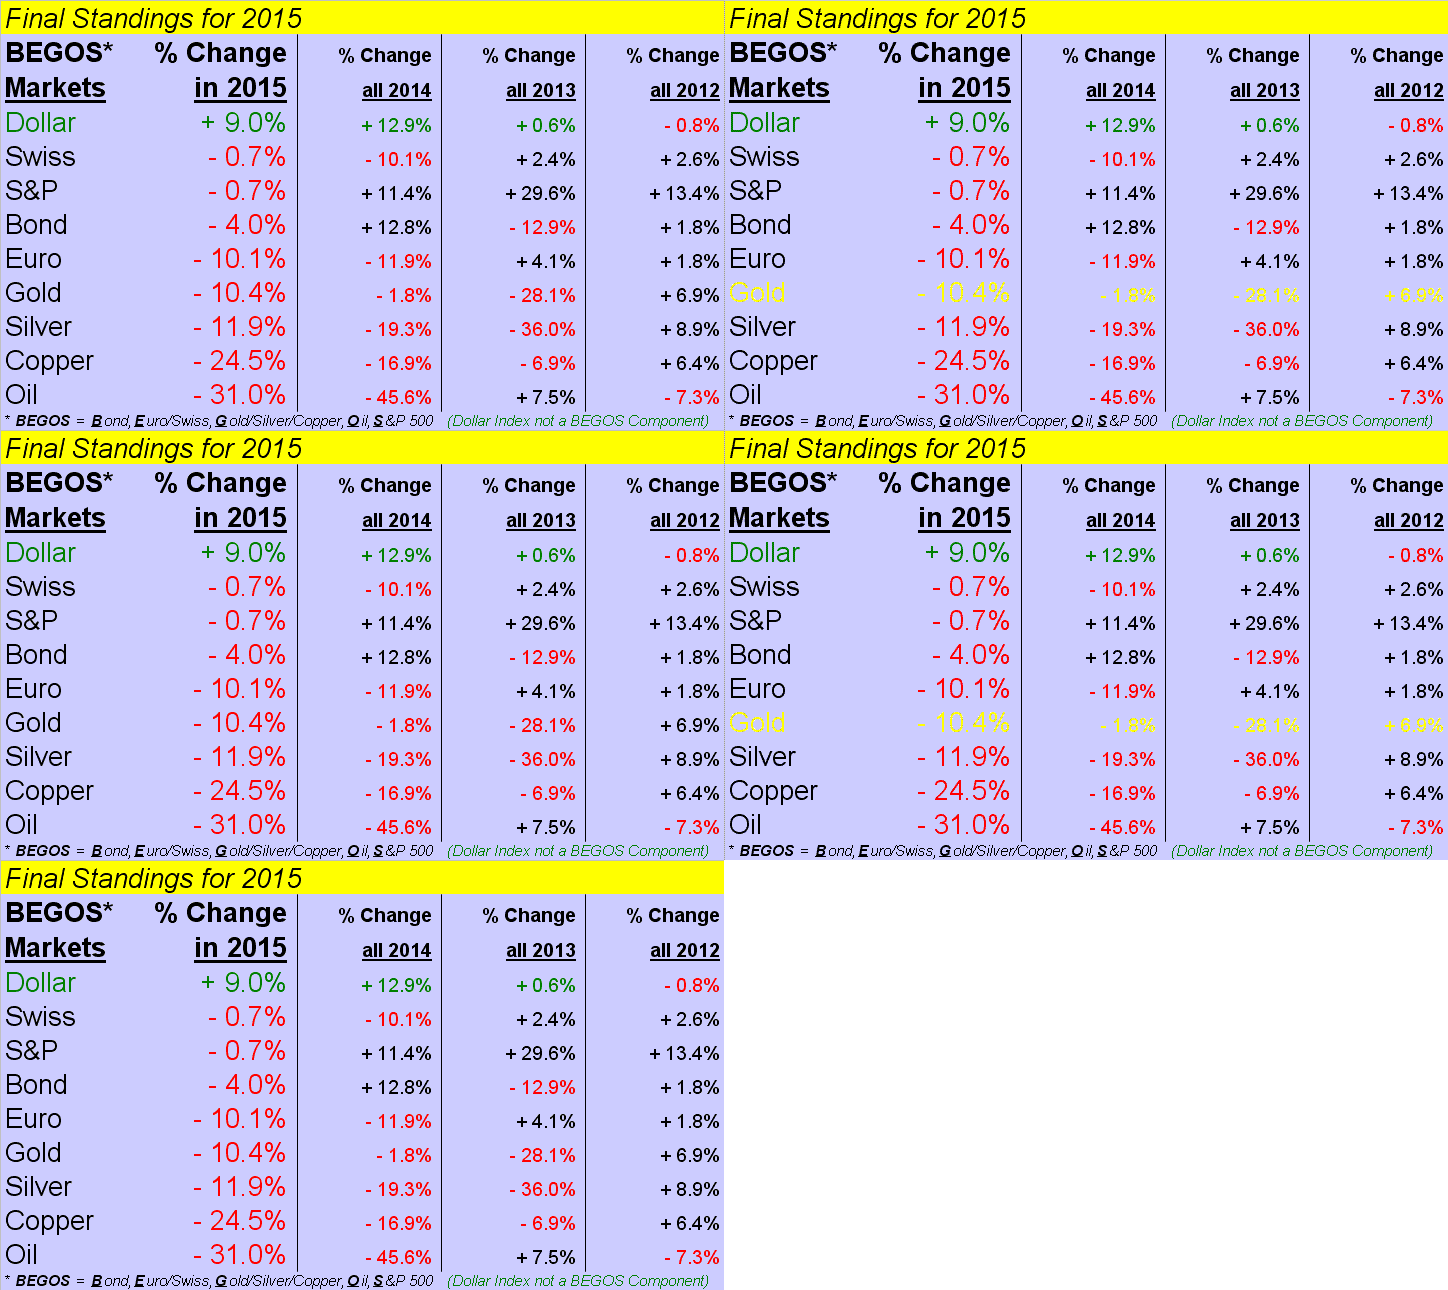
"But mmb, what you call 'the EuroCurrencies' went down by almost the same amount..."
Thank you, Squire, in enhancing the essence here, for quantitative easing has added to monetary supplies both across the Pond and the Pacific. The point is: we've merely bow-wow currencies playing off of one another, their only common denominator being their supplies increasing, indeed many-fold so in recent decades. And the craziest part of it is: in having just updated the Gold Scoreboard's data (with a tip of the cap to the World Gold Council) as to accounting for tonnage, the Gold supply since 1980 still has not quite doubled. Price therefore ought be through the roof by now, (or at least at our Scoreboard's valuation level of $2,522/oz.). And that's not counting -- when it comes -- the "overshoot". 'Twill.
As for "undershoot", in and amongst one's festive feastings this past week, did you happen to catch Chicago's Purchasing Managers Index? 'Twas a horribly contractive 42.9, the worst reading since the very depths of the Black Swan in '08/'09. What is it about which we've been musing as regards the Federal Reserve Bank? "To raise and then rescind? ... Perhaps to QE?" For here's the Baro, you see?
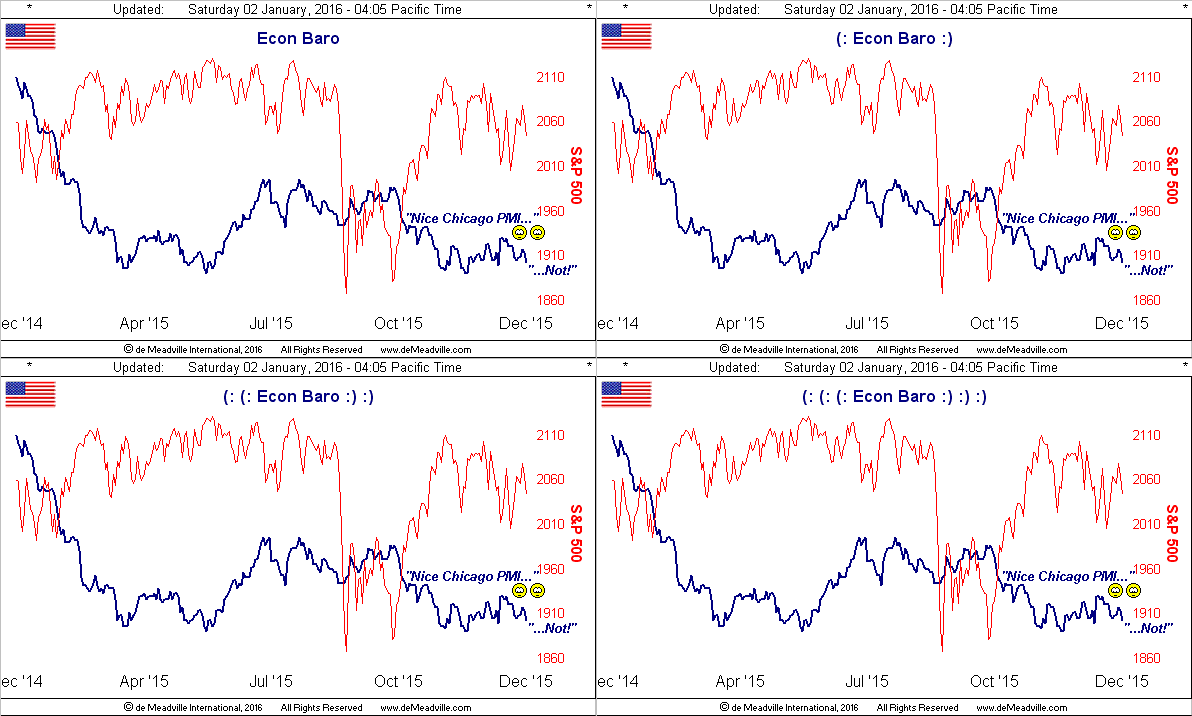
And yet, we read that "Higher Rates Will Dominate Markets in 2016". Really? The Federal Open Market Committee's next squirm session is 26-27 January. Perhaps into their private inner sanctum they ought invite as a guest speaker International Monetary Fund Managing Director Christine Lagarde: not only does the IMF see the 2016's global economic growth as disappointing, but beyond into the "medium-term", their outlook is deteriorating. One wonders if StateSide economic optics (not the reality) are so good, that the balance of the world will simply move over here. Come on in, for oxymoronically, our borders are always open.
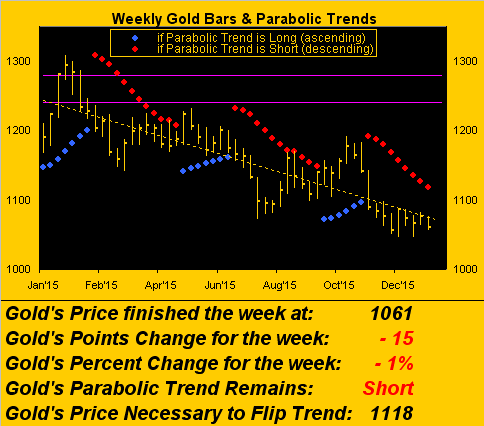
What's not open is the red-dotted border delineating the parabolic Short trend as we next see in the chart of Gold's weekly bars. That said, Gold continues the appearance of putting in a basing pattern; last week's missive showed prior similar patterns over the last three years as having all led to rallies of better than 100 points, which were same to again kick in here, we sense would take us back up into the 1200s:
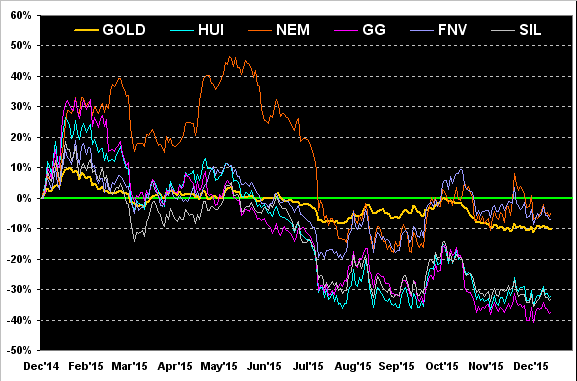
In keeping with the year-over-year theme, here are the percentage tracks through 2015 of Gold along with some of its key kinship. 'Tis interesting how they fall into two groups: in the "not too bad" division with losses ranging from -5% to -10% are Big Daddy Newmont Mining (N:NEM), the royalty company Franco-Nevada (N:FNV), and Gold itself; in "the really bad" division with losses ranging from -32% to -38% are the Gold Bugs Index (HUI), the exchange-traded fund Global X Silver Miners (N:SIL), and Big Loser Goldcorp (N:GG). 'Course, as is the wont of Precious Metals equities, upon Gold eventually getting materially up off the mat, we ought see 'em in "the super soaring" division:
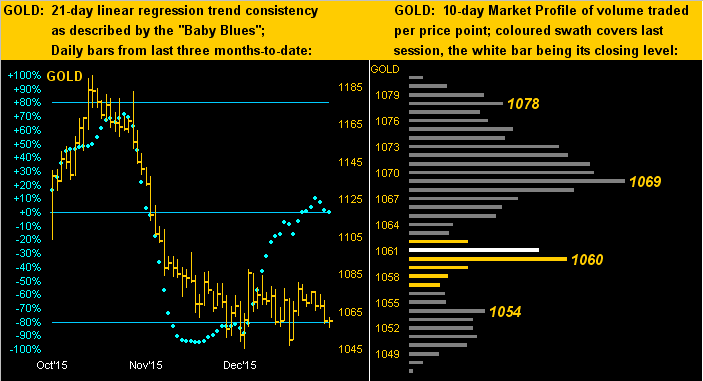
Moving nearer-term, we've next a couple of dual-panel graphics, beginning with Gold, for which on the left are its daily bars for the last three months along with the presently-stalled "Baby Blues" in their measure of 21-day linear regression trend consistency, whilst on the right is the 10-day Market Profile. As noted earlier, the appearance of price's basing (left) continues, however 'twould be put to the test should the denoted 1054 trading supporter (right) bust:
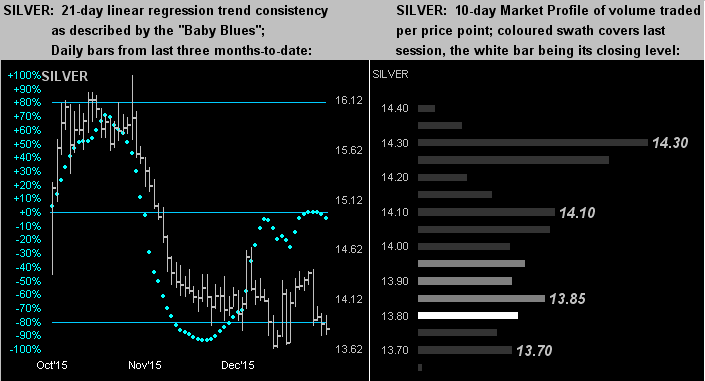
As for Sister Silver, her "Baby Blues" (left) appear as in gallop of late, but per her Market Profile (right), she's lying low in the saddle. Either way, she's certainly got a hitch in her giddy-up...
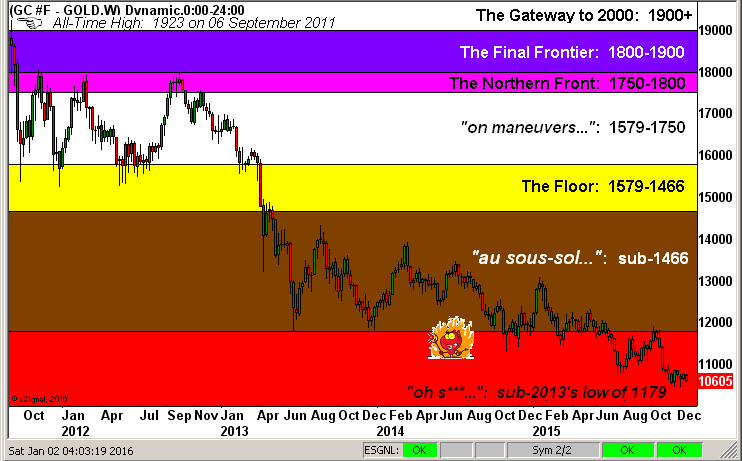
So to the sobering sight of the Big Picture. Here's our characterized chart of Gold's structure, that one character near the bottom persisting to appear as pleased as punch. He'll be given his due screw, in due course:
And speaking of screw, per the title's cue, 'tis our view to maintain one's value. Remember the S&P's fallout of further than -50% in '01/'02? Or its even faster failure by more than -50% in '08/'09? Recall in a recent missive our noting that the S&P cannot rationally go any higher than 'tis? 2015 proved that.
The level of earnings suggest the S&P "ought be" half -- at best -- its present level of 2044. 'Course, the debasement of currencies suggests Gold "ought be" double -- at least -- its present level of 1061. Means regression can be both butt-ugly and a beautiful thing. And 2016 is ripe for regression: down for the S&P and up for Gold. Write it down. Write as well to your money manager, inquiring as to the type of stock market downside insurance that has already been put in place for you, (i.e. inverse exchange-traded funds, put options, short futures positions), or if instead they'll just worry about it "if it happens" and join the panicking fray, given that misery loves company.
To be sure, stock indices tend to rise, as does one's cost of living, over the decades. And whilst some folks are now scratching their heads over the S&P having impossibly recorded a negative year, (dividends aside), you might bestow upon them a little "tough love" with a reminder that six of the past 16 years have been downers. Here's to the old-fashioned savings account and Gold!
The year's economics kick off in this first week with 16 reports to affect the Economic Barometer. Watch that Econ Baro ... and listen to that radio!