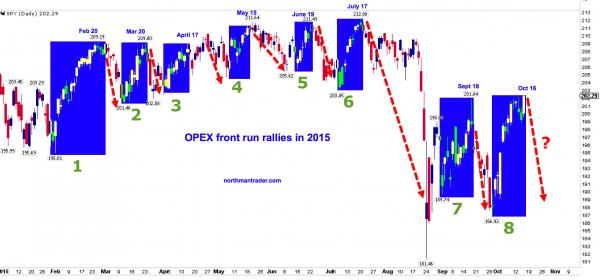
Chart of Opex Rallies and Subsequent Selloffs (h/t NorthmanTrader.com)
I’ve been noticing that the (N:SPY) put-call ratio has not been working as well as it used to as a contrary indicator in recent opex weeks, but it worked so well for so many years that I didn’t want to stop using it too hastily.
But Northman Trader’s chart shows something has changed.
This pattern may be due to the persistently elevated SPY and SPX open interest put-call ratios since the market started moving mostly sideways about a year ago.
I’m posting this chart because today’s SPY put-call ratio (based on volume) was elevated at the close, but I wouldn’t weight that too strongly. ES is at the top of a megaphone that is highly likely to retrace to its bottom at 1970, which is the neckline of an H&S formation that will probably bounce from there into a right shoulder.
And other strong set-ups on the chart suggest a crash to below the August 24 low on the breakout from that H&S.
If ES completes a topping pattern up here and breaks out downwards, it’s a strong set-up to short.
