🔺 What to do when markets are at an all-time high? Find smart bargains, like these.See Undervalued Stocks

Opening Bell: U.S. Futures, Global Stocks Rebound On U.S.-Iran Relief

Published 01/09/2020, 06:54 AM
Updated 09/02/2020, 02:05 AM
EUR/USD
-
GBP/USD
-
USD/JPY
-
XAU/USD
-
AXJO
-
JP225
-
GC
-
ESZ24
-
CL
-
GB10YT=RR
-
DE10YT=RR
-
US10YT=X
-
STOXX
-
DXY
-
MIAP00000PUS
-

  • U.S. President's measured response to Iranian retaliation allays investor fears
  • Europe hits record high
  • Contracts on U.S. indices advance with global stocks as U.S.-Iran tensions ease. While Treasurys and oil found their footing, gold and the yen extended a selloff.

    This recent geopolitical headwind comes against the backdrop of an improving narrative for the U.S.-China trade war and a U.S. Fed that joined major global central banks in supporting the economy, alongside low rates, low inflation and low growth — creating a Goldilocks economy — and helping investors accept risk.

    U.S. futures extended an advance, building on a rally for their underlying gauges, after U.S. President Donald Trump's remarks were considered tempered after a restrained Iran response to the U.S. air strike that killed General Qassem Soleimani, commander of the Quds Force last week.
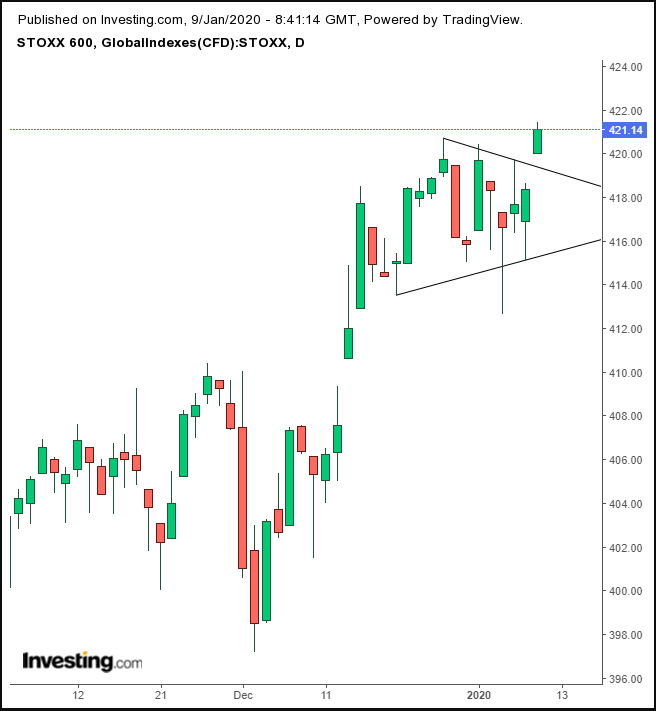
    Stoxx Daily Chart

    The STOXX Europe 600 Index opened higher, forming simultaneously a rising gap and an upside breakout of a congestion serving as a continuation pattern – rising for the third straight day and scoring a new record, to boot.

    Asia was painted green across the digital boards. Japan’s Nikkei outperformed, surging 2.31%, and even Australia’s ASX 200, the lagger, gained 0.83.
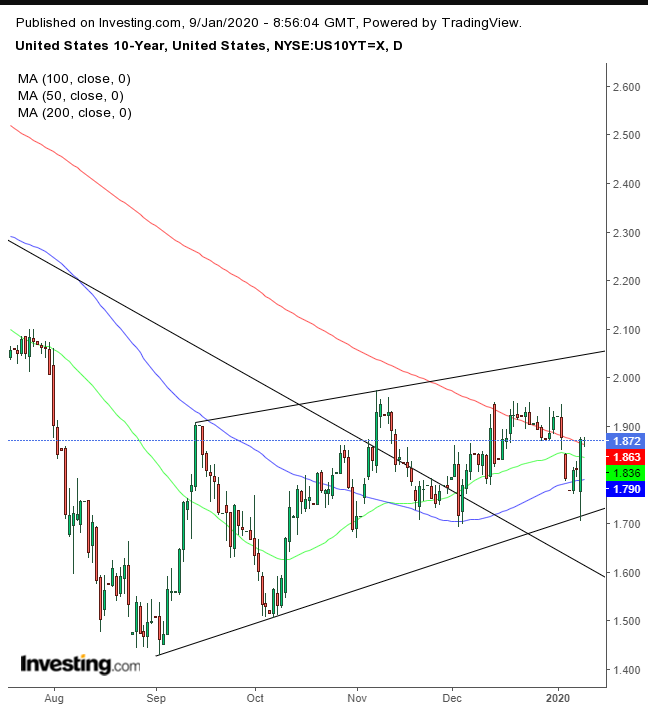
    UST Daily Chart

    Treasurys were sold off after Iran’s retaliation was not as bad as feared. Technically, yields returned to struggle with the 200 DMA, which has been a focal point for rates since Dec. 12, after yields crossed above the downtrend line since November 2018. Rates seem to be struggling between the long-term downtrend whose top was November 2018 and the short-term uptrend, from the Sept. 3 bottom.
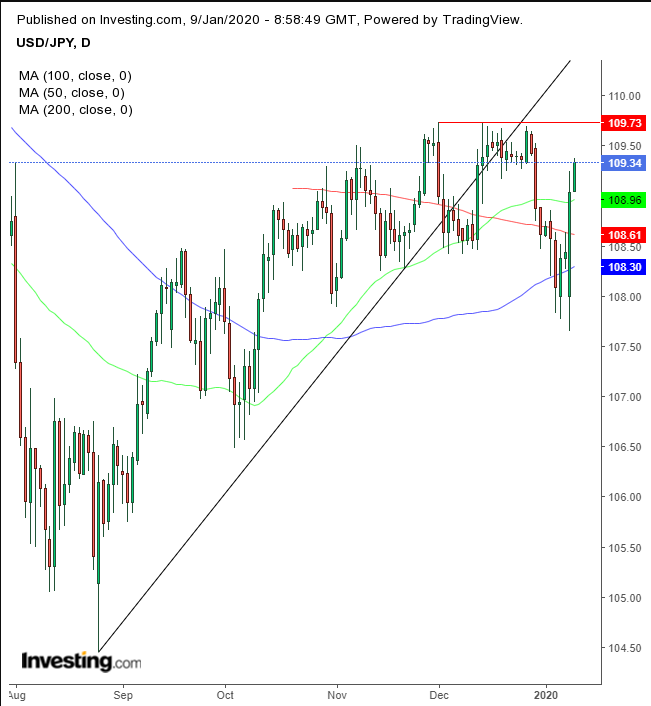
    JPY Daily Chart

    The dollar extended the rebound against the yen to the fourth day, crossing back above all the major moving averages. However, the dollar-yen pair is still below the December highs, which met a resistance that forced the pair below its uptrend line since late August.
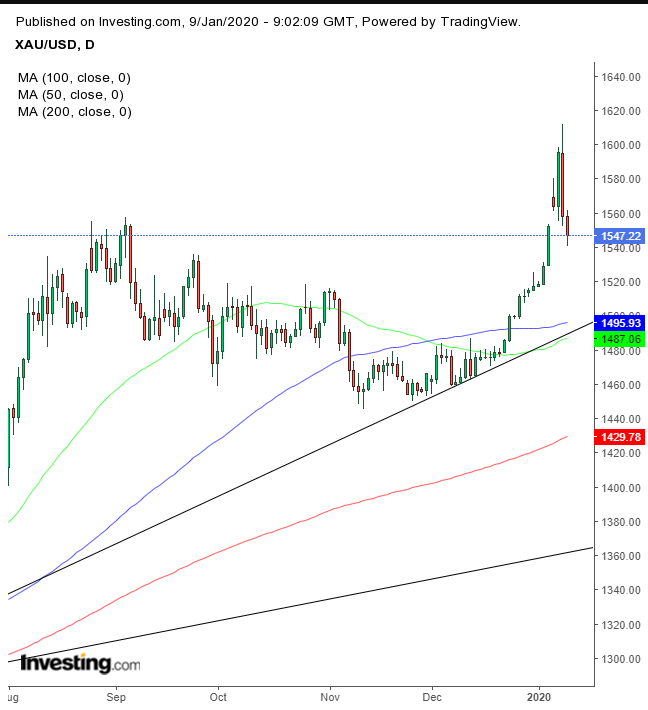
    XAU/USD Daily Chart

    Gold, too, retreated from the heights of fears of military escalation in the Middle East. Gold has had a powerful rally, opening the possibility for profit taking. We can see how far it surged above its recent uptrend line below the $1,500 psychological level, and before that, by the longer uptrend line, at $1,365.
    WTI Daily Chart

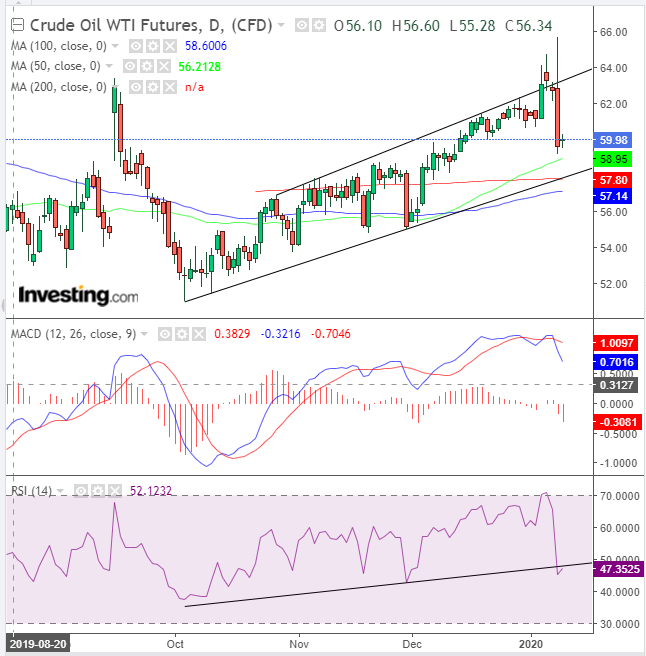
    After dropping for three days, oil established its footing. Technically, it found support above the 50 DMA, which recently climbed above the 200 DMA triggering a Golden Cross, at the bottom of a rising channel. The MACD and RSI suggest oil has room to fall.

    Up Ahead

  • Federal Reserve officials Richard Clarida, John Williams, James Bullard and Charles Evans speak on Thursday.
  • The U.S. monthly non-farm employment report is due Friday.
  • Market Moves

    Stocks

  • Futures on the S&P 500 Index rose 0.3%
  • The Stoxx Europe 600 Index rose 0.4%.
  • Currencies

  • The MSCI Asia Pacific Index gained 1.3%.
  • The Dollar Index was little changed.
  • The euro increased 0.1% to $1.1113.
  • The British pound climbed 0.1% to $1.3105.
  • The Japanese yen weakened 0.2% to 109.35 per dollar.
  • Bonds

    • The yield on 10-year Treasuries fell less than one basis point to 1.87%.
    • Germany’s 10-year yield climbed one basis point to -0.19%.
    • Britain’s 10-year yield increased one basis point to 0.83%.

    Commodities

  • West Texas Intermediate crude fell 0.1% to $59.57 a barrel.
  • Gold decreased 0.6% to $1,546.31 an ounce.
  • Latest comments

    Loading next article…
    Risk Disclosure: Trading in financial instruments and/or cryptocurrencies involves high risks including the risk of losing some, or all, of your investment amount, and may not be suitable for all investors. Prices of cryptocurrencies are extremely volatile and may be affected by external factors such as financial, regulatory or political events. Trading on margin increases the financial risks.
    Before deciding to trade in financial instrument or cryptocurrencies you should be fully informed of the risks and costs associated with trading the financial markets, carefully consider your investment objectives, level of experience, and risk appetite, and seek professional advice where needed.
    Fusion Media would like to remind you that the data contained in this website is not necessarily real-time nor accurate. The data and prices on the website are not necessarily provided by any market or exchange, but may be provided by market makers, and so prices may not be accurate and may differ from the actual price at any given market, meaning prices are indicative and not appropriate for trading purposes. Fusion Media and any provider of the data contained in this website will not accept liability for any loss or damage as a result of your trading, or your reliance on the information contained within this website.
    It is prohibited to use, store, reproduce, display, modify, transmit or distribute the data contained in this website without the explicit prior written permission of Fusion Media and/or the data provider. All intellectual property rights are reserved by the providers and/or the exchange providing the data contained in this website.
    Fusion Media may be compensated by the advertisers that appear on the website, based on your interaction with the advertisements or advertisers.
    © 2007-2024 - Fusion Media Limited. All Rights Reserved.