Last week’s review of the macro market indicators saw heading into the heat of Summer and earnings season, that the equity markets were a bit mixed but all strong on the shorter timeframe. Elsewhere looked for Gold ($GLD) to pause in its uptrend, holding around 1400, while Crude Oil ($USO) paused in the pullback. The US Dollar Index ($DXY) looked to reverse higher in consolidation while US Treasuries ($TLT) pulled back in their uptrend.
The Shanghai Composite ($ASHR) looked to continue the messy uptrend while Emerging Markets ($EEM) stalled in their move higher. Volatility ($VXXB) looked to remain very low keeping the bias higher for the equity index ETF’s $SPY, $IWM and $QQQ. Their short term charts were all positive, looking for more upside. But on the longer timeframe the SPY (NYSE:SPY) and QQQ were decidedly more bullish, triggering patterns with very big potential moves, while the IWM remained stuck in a range.
The week played out with Gold marking time sideways early and then a late week spike sold off to end slightly higher while Crude Oil found support and revered higher. The US Dollar met resistance at a lower high and pulled back while Treasuries dropped all week after a gap up open Monday. The Shanghai Composite broke through support Monday and then consolidated while Emerging Markets churned in a tight range.
Volatility found support and tried to move higher but fell back by the end of the week, keeping the bias higher for equities. The Equity Index ETF’s held near the highs early in bull flags, with the SPY and QQQ starting higher midweek and making new all-time highs, while the IWM continued to move sideways. What does this mean for the coming week? Let’s look at some charts.
SPY Daily, $SPY

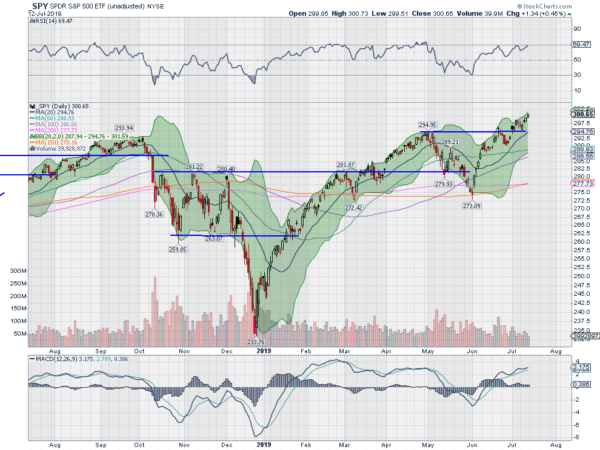
The SPY had ended last week pulling back to retest its mid week breakout that resulted in a new all-time high. It had a quiet Monday drifting lower inside Friday’s range and then opened with a gap down Tuesday. That was bought all day and closed higher. Wednesday saw a gap up hold and then another Thursday get closed before returning to the highs.
Friday repeated the pattern with a new all-time high close and over the big round number 300. The daily chart shows the RSI strong in the bullish zone, and not overbought, with the MACD rising. The Bollinger Bands® are pointing higher as price rides along the top of the channel.
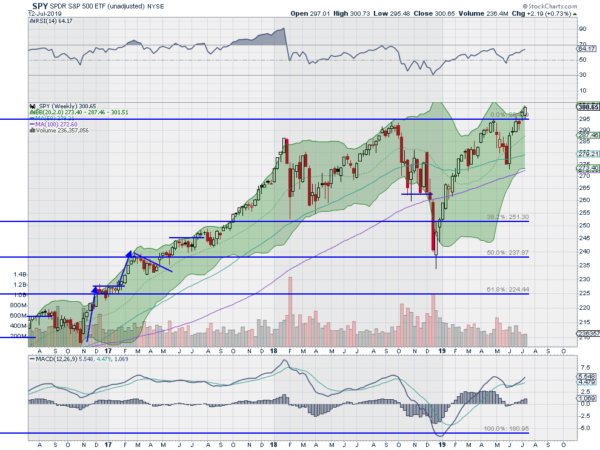
The weekly chart shows a stronger candle continuing to the upside. The Bollinger Bands on this timeframe are starting to open higher as well. The RSI is rising in the bullish zone with the MACD positive and moving higher. There is no resistance higher but there is a Measured Move to over 345. Support lower is at 298.80 and 296.75 then 295 and 294 before 292 and 290. Uptrend.
SPY Weekly, $SPY

Heading into July Options Expiration the equity markets are gaining strength with the SPY and QQQ strong and at record highs. Elsewhere look for Gold to continue to pause in its uptrend while Crude Oil advances higher. The US Dollar Index continues to move sideways in a broad range while US Treasuries pullback in their uptrend. The Shanghai Composite looks to have reversed lower while Emerging Markets may be pausing or shifting to consolidation.
Volatility looks to remain very low keeping the bias higher for the equity index ETF’s SPY, IWM and QQQ. The SPY and QQQ are playing along with record highs and showing strength. The IWM, while not showing weakness, remains stuck in the range it has been in since February. Use this information as you prepare for the coming week and trad’em well
Disclaimer: The information in this blog post represents my own opinions and does not contain a recommendation for any particular security or investment. I or my affiliates may hold positions or other interests in securities mentioned in the Blog, please see my Disclaimer page for my full disclaimer.
