Thursday was another good day in the markets. All equity indexes closed higher and broke above their short term ranges. For some reason traders want to look at this and short them going into Friday to end the week. But that looks pretty dangerous.
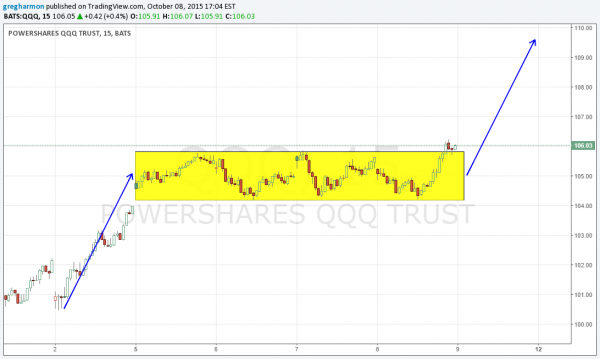
The chart below is a 15 minute timeframe of the Nadsaq 100 ETF (NASDAQ:QQQ) over the last 5 days. I have removed everything from the chart except for the price action itself. What is left id a very simple and very bullish pattern.

Friday last week the Nasdaq 100 made a big move higher from around 101 to 105. Since then the QQQ’s traded for most of 4 days in a range between 104.20 and 105.80, as shown by the yellow box. That ended with the last hour of trading Thursday, when the price moved up and out of the yellow box.
This may not seem like much but it is a very significant move. By breaking the consolidation range to the upside, you can now look for the QQQ’s to move higher. How much higher? Technical analysis would suggest all the way up to 109.60 in a Measured Move. Symmetry would suggest it all happens Friday. Now, do you want to short the market against that?
The information in this blog post represents my own opinions and does not contain a recommendation for any particular security or investment. I or my affiliates may hold positions or other interests in securities mentioned in the Blog, please see my Disclaimer page for my full disclaimer.
