Is This Market Just A One-Edged Sword?

Published 07/31/2016, 01:06 AM
Updated 07/09/2023, 06:31 AM
USD/JPY
-
DJI
-
US2000
-
ESH25
-
CL
-
IXIC
-
DJT
-
DJA
-
VIX
-

It turns out the Brexit was just about the worst thing that could have happened to the bears. On the night it happened, I was ecstatic. I thought, finally, “this is it” – – a real turning point. Nope! The bounce emboldened the bulls, and they have been slicing bear throats ever since.

Virtually every day has brought more disappointment. My “tripod” of 2016 – BULLISH bonds, BULLISH precious metals, BEARISH equities – has been pretty much “2 out of 3” all year. Bonds are at lifetime highs, gold and silver are strong, but equities………curse them…….keep lurching to levels never before seen in human history.

The divergences are getting grotesque. Stocks “should” be lower due to

(1) a collapsing crude oil market
(2) a soaring Japanese yen
(3) plunging interest rates

……….and yet……..nope. Indeed, I’m wondering if the market is just a 1-edged sword, because if these three factors actually move in favor of the bulls (strong oil, weak yen, strong interest rates), won’t it just mean that the Dow goes roaring past 20,000 and beyond?

The Dow Jones Composite needs to break below the purple line for the bears to have a fighting chance; if we get above the teal line, screw it, 2016 is complete toast for the bears.
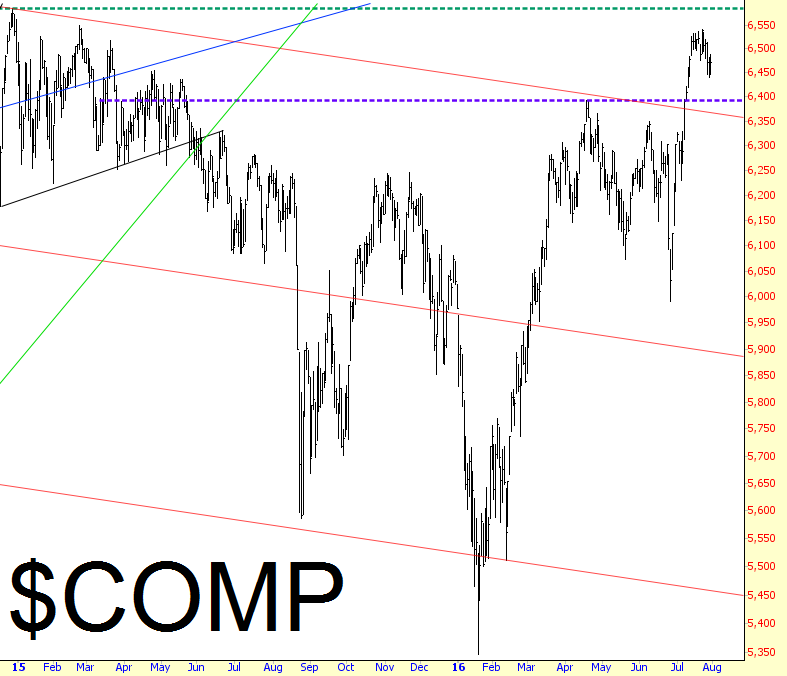
Dow Composite Chart

The NASDAQ is likewise supporting the bull case, as it threatens to push into lifetime highs.
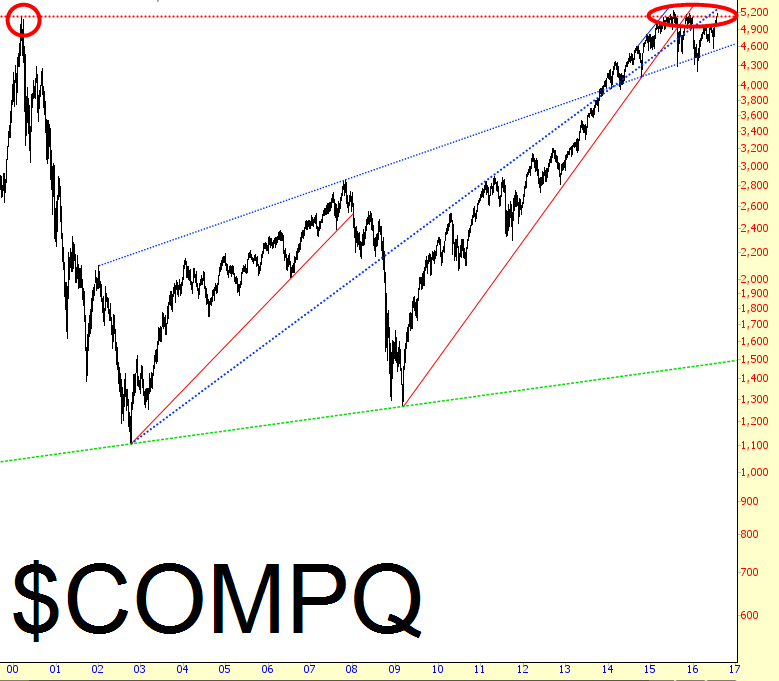
NASDAQ Composite Chart

The Russell 2000 expresses its threat to the bulls by way of the upper blue trendline; as with the COMP, the bears can just hang it up for 2016 if we get above that line (and believe me, I’m closing to hanging it up for good).
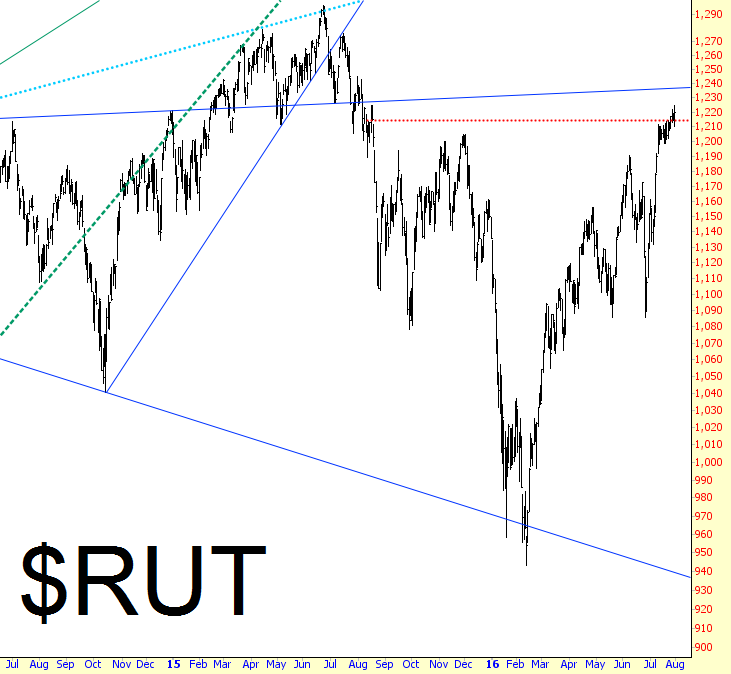
Russell 2000 Chart

Just about the only index which is clear-as-can-be bearish still is the Transports.
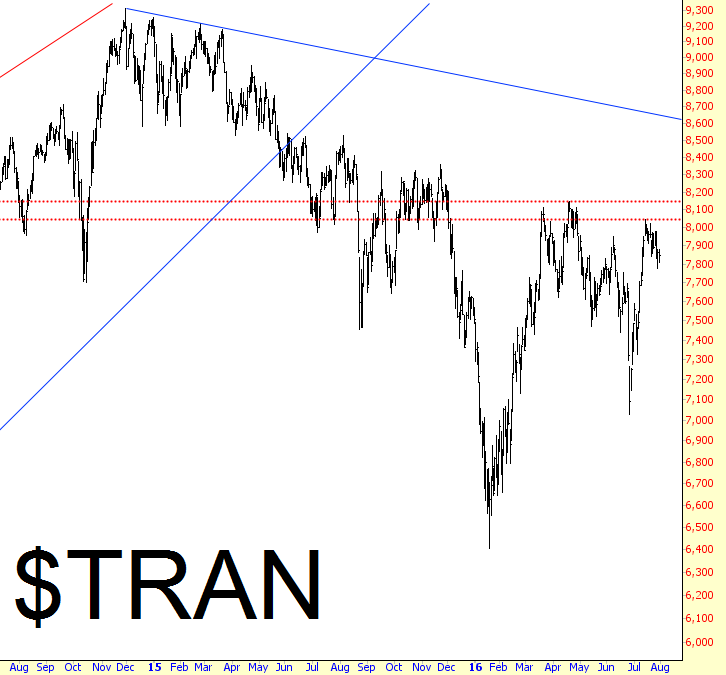
Transports Chart

The past five months have been an absolute desert. There was ONE, count ’em, ONE, exciting moment, and that was Brexit. Take note of the “cluster” of VIX surges that took place late in December and early in January. How about since then? Jack. Squat.
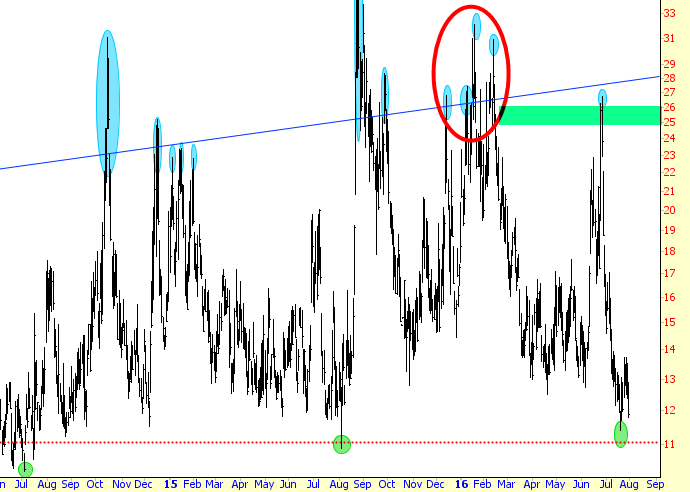
VIX Chart

All you need to watch is the ES. I just read it hasn’t been in a range this tight for this long since Richard Freakin’ NIXON was in office. Break the range, and we move where I’ve drawn the arrows.
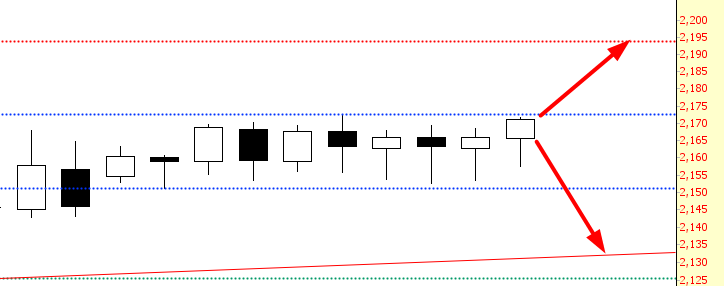
ES Chart

For me, personally, my enthusiasm about charting and trading looks about like this:

Gas Gage

Latest comments

Loading next article…
Risk Disclosure: Trading in financial instruments and/or cryptocurrencies involves high risks including the risk of losing some, or all, of your investment amount, and may not be suitable for all investors. Prices of cryptocurrencies are extremely volatile and may be affected by external factors such as financial, regulatory or political events. Trading on margin increases the financial risks.
Before deciding to trade in financial instrument or cryptocurrencies you should be fully informed of the risks and costs associated with trading the financial markets, carefully consider your investment objectives, level of experience, and risk appetite, and seek professional advice where needed.
Fusion Media would like to remind you that the data contained in this website is not necessarily real-time nor accurate. The data and prices on the website are not necessarily provided by any market or exchange, but may be provided by market makers, and so prices may not be accurate and may differ from the actual price at any given market, meaning prices are indicative and not appropriate for trading purposes. Fusion Media and any provider of the data contained in this website will not accept liability for any loss or damage as a result of your trading, or your reliance on the information contained within this website.
It is prohibited to use, store, reproduce, display, modify, transmit or distribute the data contained in this website without the explicit prior written permission of Fusion Media and/or the data provider. All intellectual property rights are reserved by the providers and/or the exchange providing the data contained in this website.
Fusion Media may be compensated by the advertisers that appear on the website, based on your interaction with the advertisements or advertisers.
© 2007-2025 - Fusion Media Limited. All Rights Reserved.