Street Calls of the Week
How can you tell if we are in a real estate bubble? How about:
- Homes sell within hours
- Homes sell above asking price
- Homes sell ‘sight unseen’
- Sellers live for free in the home even after it’s sold
- Buyers have to show their eternal gratitude by putting a statue of the sellers in the front yard (that hasn’t happened yet, but one buyer did offer to name the first-born after the seller)
Anybody who’s lived through the 2000 tech, the 2005 real estate, and the 2007 financial leverage bubbles may feel a sense of déjà vu. Although my contrarian antennae are on high alert, I realize that there are plenty of reasons for real estate prices to keep climbing.
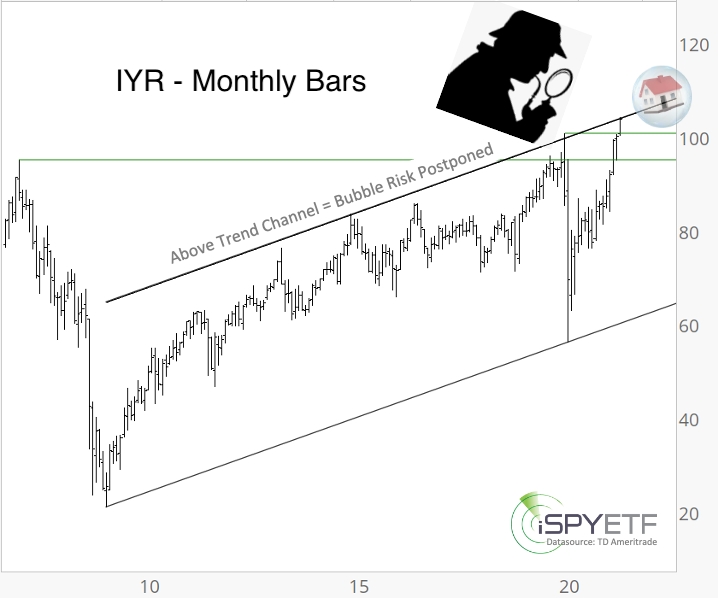
Here is one chart I’ll be using to gauge the bubble risk for real estate.
The iShares US Real Estate ETF (NYSE:IYR) is at long-term trend channel resistance. This channel has contained price action for over a decade. While below the channel, risk is elevated, any risk is postponed, however, if price climbs above the channel (and for as long as it stays above). 
Sometimes, reaction to a trend channel is quick and clear (instant breakout or breakdown), but it doesn’t have to be that way.
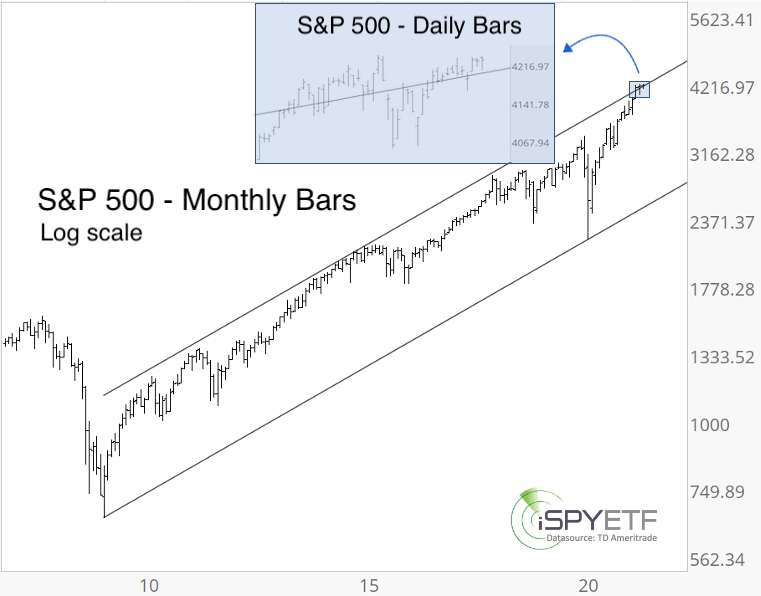
The S&P 500 has been battling with its very own trend channel resistance. The daily chart insert explains why the S&P 500 has been stuck. Sometimes the trend channel acts as a magnet before repelling or propelling price. 
In short, while the channel doesn’t predict the outcome, it offers a specific level to help judge bubble risk and an explanation if price decides to stall.
