During the current bull market, I have favored a “Stay Home” investment strategy over the “Go Global” alternative. That’s worked quite well, though I’ve missed some opportunities to outperform overseas, particularly in Japan, where stocks have soared since late 2012 when Abenomics was introduced. Of course, to benefit, dollar-based portfolio managers had to short the yen at the same time. Let’s have a closer look at some of the performance stats so far this year and since the start of the bull market:
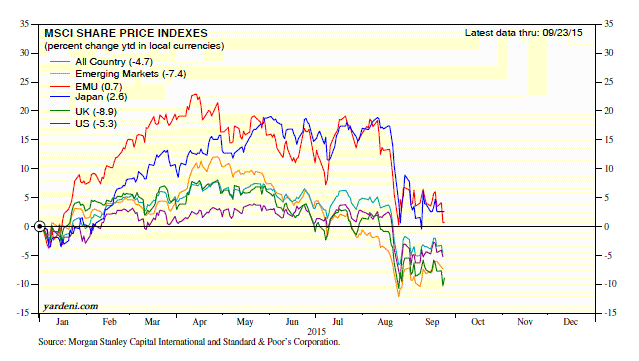
(1) Major markets giving back gains. The MSCI USA stock price index is down 5.3% YTD (through Tuesday), and has underperformed since the start of the year. The All Country World MSCI and All Country World ex-US MSCI are down 4.7% and 4.0% YTD in local currencies. However, the UK MSCI is down 10.3% YTD, while the Emerging Markets MSCI is down 7.4% since the start of the year. Japan (2.6%) and the EMU (0.6%) have been outperforming all year, but have recently given back most of their strong gains earlier this year.
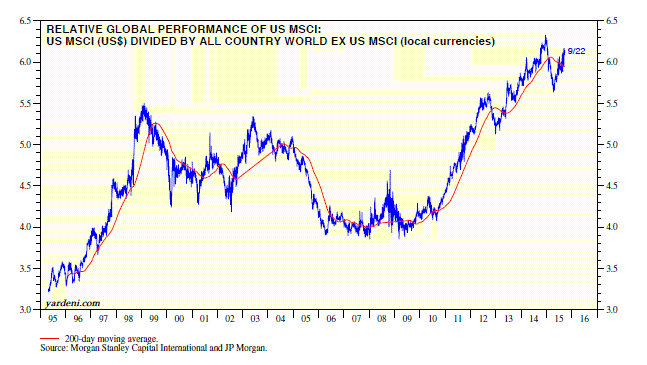
(2) Shining city on the hill. Since the start of the current bull market on March 9, 2009, the US MSCI is up 188%, while the All Country World ex-US is up 77% in dollar terms and 83% in local currencies. The ratio of the US index to the world local-currency index charted over time shows that the US underperformed briefly in late 2012 and earlier this year. The US has been outperforming since late 2010 according to this ratio.
(3) Reversal of fortune for MEI sectors. During the bull market of the previous decade, I favored overweighting the Materials, Energy, and Industrials (MEI) sectors of the S&P 500. They were up 154%, 223%, and 125%, well ahead of the S&P 500’s gain of 96% from March 11, 2003 through October 9, 2007.
Since the start of the current bull market, they’ve mostly underperformed, especially this year, with gains of 138%, 48%, and 228% versus 187% for the S&P 500. These sectors tend to do best when Go Global is outperforming Stay Home, which it did during the previous bull market, but not during the current bull market. The performances of Energy and Materials in particular have suffered this year as commodity prices plunged. The outperformance of the Industrials sector during the current bull market is mostly attributable to transportation stocks.
(4) Weak currencies less bullish for EMU and Japan. Stock prices rose in both the Eurozone and Japan in recent years, despite lackluster economic growth. Investors turned bullish on both after the ECB and BOJ stated their commitments to do whatever it takes to revive growth. The two central banks implemented QE programs aimed at depreciating their currencies to boost exports. So far, the results have been disappointing, which may be reflected in the 18.1% decline in the EMU MSCI (in euros) since April 13, and the 13.8% decline in the Japan MSCI (in yen) since June 1.
(5) Emerging markets submerging again. The Emerging Markets MSCI (in local currencies) performed relatively well during the current bull market until the recent selloff. However, it underperformed in US dollar terms since 2012, and especially this year. The dollar-denominated index is highly correlated with the CRB raw industrials spot price index. This isn’t surprising since the strength or weakness of the global economy has a big influence on both. The bottom line, though, is that the EM MSCI is really just a proxy for commodity prices.
Today's Morning Briefing: Homebodies. (1) Home sweet home. (2) Avoiding cabin fever. (3) Major global equity markets giveth and taketh away. (4) It’s all relative: US outperforming again. (5) “Go Global” was a great theme for previous bull market, not this one. (6) Currency depreciation hasn’t done much for economies of EMU and Japan. (7) Emerging Markets MSCI is just a commodities proxy. (8) Losses for commodity producers provide some material gains for homebuilders. (9) Will Millennials ever leave the nest (or dorm room)? (10) Getting tougher to rent. (11) Some wet blankets. (12) A positive feedback loop if homebuilders can find construction workers.

